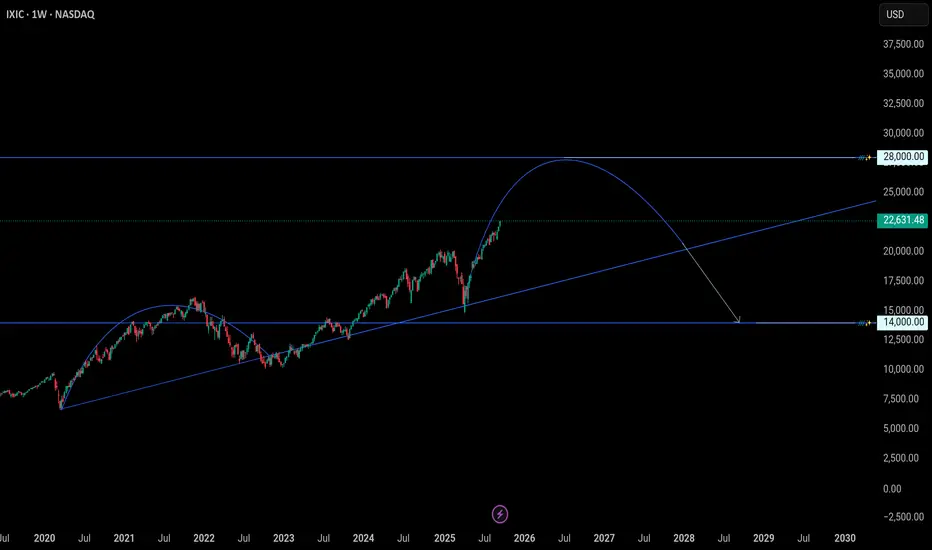
The weekly NASDAQ Composite (IXIC) chart shows a strong uptrend, Price action has respected a long-term ascending support line and is approaching the next key resistance near 28,000. The overlaid arc suggests a possible medium-term rally toward that 28,000 zone before a significant pullback, potentially toward 14,000, which aligns with a major support.
免责声明
这些信息和出版物并不意味着也不构成TradingView提供或认可的金融、投资、交易或其它类型的建议或背书。请在使用条款阅读更多信息。