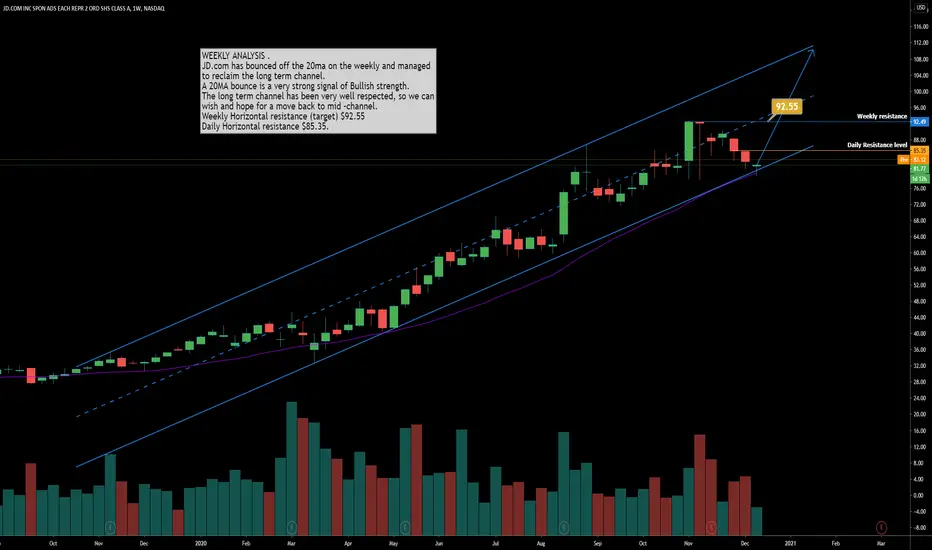
JD.com has bounced off the 20ma on the weekly and managed
to reclaim the long term channel.
A 20MA bounce is a very strong signal of Bullish strength.
The long term channel has been very well respected, so we can
wish and hope for a move back to mid -channel.
Weekly Horizontal resistance (target) $92.55
Daily Horizontal resistance $85.35.
注释
注释
Daily chart shows a safer entry above MA's免责声明
The information and publications are not meant to be, and do not constitute, financial, investment, trading, or other types of advice or recommendations supplied or endorsed by TradingView. Read more in the Terms of Use.
免责声明
The information and publications are not meant to be, and do not constitute, financial, investment, trading, or other types of advice or recommendations supplied or endorsed by TradingView. Read more in the Terms of Use.