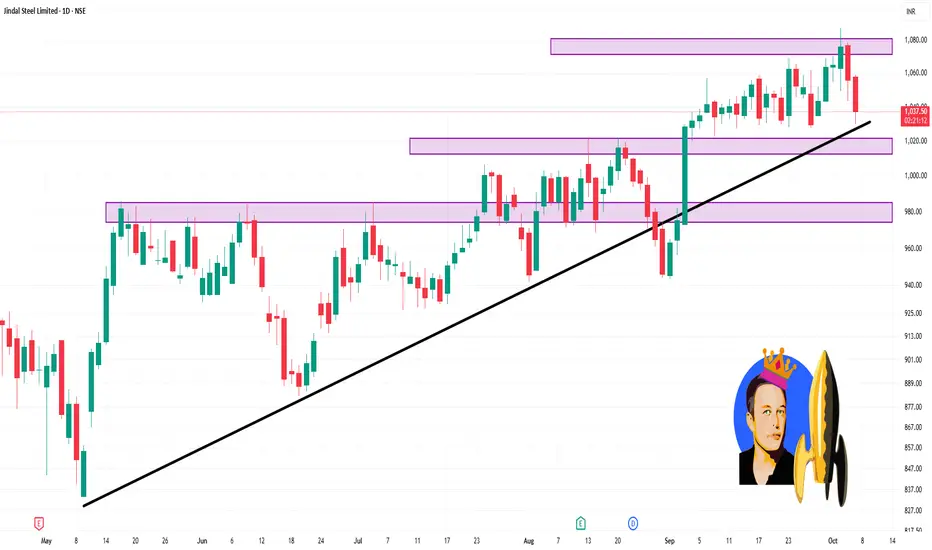
📈 Intraday Support & Resistance Levels
Resistance Levels:
₹1,078.87
₹1,071.93
₹1,063.47
Support Levels:
₹1,056.54
₹1,048.07
₹1,041.13
These levels are derived from pivot point calculations and are useful for short-term trading decisions.
🔍 Technical Indicators
Relative Strength Index (RSI): Currently at 39.78, indicating a bearish condition.
MACD: At -3.67, suggesting a bearish trend.
Moving Averages: The stock shows a strong sell outlook based on moving averages ranging from MA5 to MA200, with 2 buy signals and 10 sell signals.
相关出版物
免责声明
这些信息和出版物并不意味着也不构成TradingView提供或认可的金融、投资、交易或其它类型的建议或背书。请在使用条款阅读更多信息。