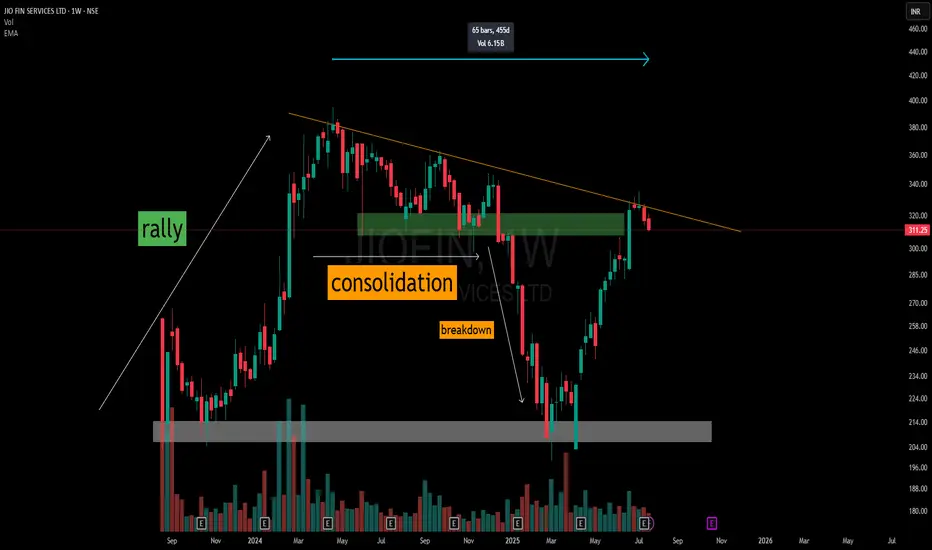
This weekly chart of Jio Fin Services Ltd illustrates a multi-phase price structure over 455 days:
🔹 Initial Rally — Kicks off from a defined accumulation base (grey zone), marking the start of a strong impulse leg.
🔹 Consolidation Phase — Price enters a descending triangle formation just below a historical resistance band.
🔹 Breakdown — Clean breakdown from the triangle pattern sends price sharply downward.
🔹 V-Shaped Recovery — A strong reaction off the original base zone leads to a sharp reversal.
🔹 Back to the 455-Day Counter Trendline — Price now tests the long-standing counter trendline, which has remained intact throughout.
📌 This chart demonstrates how historical price structures—especially well-defined base formations and trendline resistances—continue to act as critical reference points for future price action.
🛠️ No predictions here. Just a structured breakdown of price behavior and major decision zones traders are often drawn to.
✅ Telegram ( More Charts) : t.me/hashtaghammer
✅ WhatsApp (Contact me) : wa.me/919455664601
✅ YouTube (More Content) : youtube.com/@HashtagHammer
✅ WhatsApp (Contact me) : wa.me/919455664601
✅ YouTube (More Content) : youtube.com/@HashtagHammer
相关出版物
免责声明
这些信息和出版物并不意味着也不构成TradingView提供或认可的金融、投资、交易或其它类型的建议或背书。请在使用条款阅读更多信息。