⚡ JK CEMENT – Wave 4 Correction Completing | Wave 5 Blast Loading?
🧠 Overall Market Structure
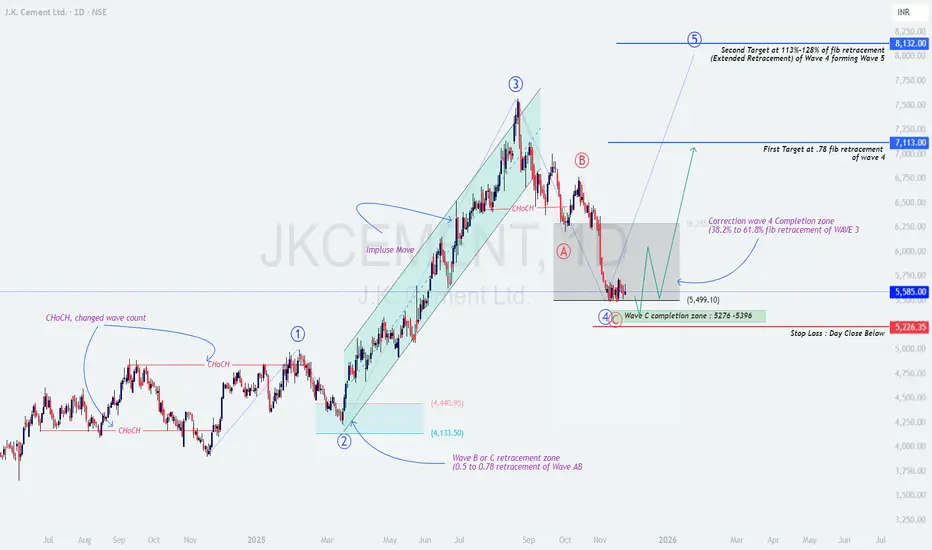
JK Cement is showing a textbook Elliott Wave progression, and price has now entered the crucial Wave 4 → Wave C completion zone (₹5276–₹5396).
This zone aligns with 38.2% to 61.8% retracement of Wave 3, making it a high-probability reversal area 📌.
The chart shows:
Strong Impulse Wave 3 with clean channel movement
Clear ChoCH (Change of Character) at the top → signaling the start of Wave 4
A complete A-B-C correction structure into the green demand zone
Price now sitting exactly where a bullish reversal is expected
This is where Wave 5 usually begins ⚡.
📚 Educational Insights
🎯 Prediction & Price Outlook
If price holds above the ₹5276–₹5396 support range and forms a reversal candle, the next major move could be a Wave 5 rally.
🚀 First Target: ₹7113 (0.78 retracement of Wave 4)
🚀 Second Target: ₹8132 (113%–128% extended retracement → typical Wave 5 zone)
A breakout above ₹6285 strengthens the confirmation of Wave 5 activation.
🛑 Stop Loss (Closing Basis): ₹5226
💡 Trading Strategy (Educational Purpose Only)
🧩 Summary
JK Cement is showing a perfect Wave 4 completion setup at a major Fibonacci demand zone.
If the structure holds and reversal emerges, a strong Wave 5 rally could unfold toward ₹7113 and ₹8132 🎯.
This is a high-probability zone for trend continuation traders and Elliott Wave followers.
⚠️ Disclaimer
I am not a SEBI-registered analyst.
This analysis is for educational and informational purposes only — not financial advice.
🧠 Overall Market Structure
JK Cement is showing a textbook Elliott Wave progression, and price has now entered the crucial Wave 4 → Wave C completion zone (₹5276–₹5396).
This zone aligns with 38.2% to 61.8% retracement of Wave 3, making it a high-probability reversal area 📌.
The chart shows:
Strong Impulse Wave 3 with clean channel movement
Clear ChoCH (Change of Character) at the top → signaling the start of Wave 4
A complete A-B-C correction structure into the green demand zone
Price now sitting exactly where a bullish reversal is expected
This is where Wave 5 usually begins ⚡.
📚 Educational Insights
- 📘 Impulse Wave vs Corrective Wave:
Wave 3 was an impulsive move — long, strong, and directional.
Wave 4 is corrective in nature — choppy and overlapping. This is normal and healthy before Wave 5 begins. - 🎯 38.2%–61.8% Retracement Rule:
Wave 4 typically retraces 38.2% to 61.8% of Wave 3.
JK Cement’s price has corrected exactly into this Fibonacci zone — strengthening reversal probability. - 🔄 A-B-C Correction Pattern:
Wave 4 often forms an A-B-C pattern.
This chart shows a clean A (fall) → B (pullback) → C (final drop) into demand — classic Wave 4 behavior. - 🌀 Wave 5 Potential:
Wave 5 tends to be a trend-continuation wave.
Targets are often based on Fibonacci extensions of Wave 4 — exactly what we’re projecting here.
🎯 Prediction & Price Outlook
If price holds above the ₹5276–₹5396 support range and forms a reversal candle, the next major move could be a Wave 5 rally.
🚀 First Target: ₹7113 (0.78 retracement of Wave 4)
🚀 Second Target: ₹8132 (113%–128% extended retracement → typical Wave 5 zone)
A breakout above ₹6285 strengthens the confirmation of Wave 5 activation.
🛑 Stop Loss (Closing Basis): ₹5226
💡 Trading Strategy (Educational Purpose Only)
- 🟢 Entry Zone: ₹5276–₹5396
Look for Hammer, Bullish Engulfing, or ChoCH on lower timeframes. - 📈 Confirmation Trigger:
Break above ₹6285 → safer entry with trend confirmation. - 🎯 Targets:
• Target 1 → ₹7113
• Target 2 → ₹8132 - ⚖️ Risk Management:
• SL below ₹5226 (daily close)
• Risk 1–2% total capital
• Avoid chasing — wait for structure confirmation
🧩 Summary
JK Cement is showing a perfect Wave 4 completion setup at a major Fibonacci demand zone.
If the structure holds and reversal emerges, a strong Wave 5 rally could unfold toward ₹7113 and ₹8132 🎯.
This is a high-probability zone for trend continuation traders and Elliott Wave followers.
⚠️ Disclaimer
I am not a SEBI-registered analyst.
This analysis is for educational and informational purposes only — not financial advice.
免责声明
这些信息和出版物并非旨在提供,也不构成TradingView提供或认可的任何形式的财务、投资、交易或其他类型的建议或推荐。请阅读使用条款了解更多信息。
免责声明
这些信息和出版物并非旨在提供,也不构成TradingView提供或认可的任何形式的财务、投资、交易或其他类型的建议或推荐。请阅读使用条款了解更多信息。