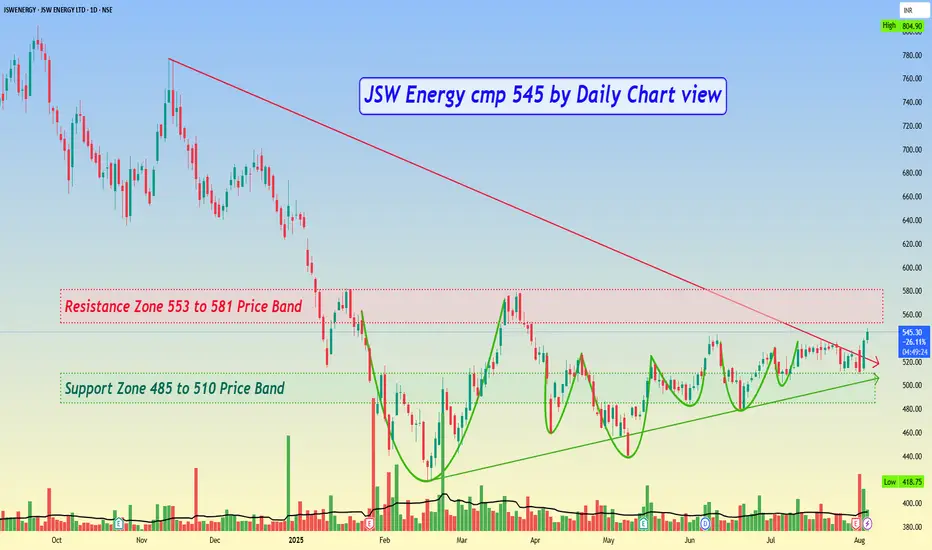
JSW Energy cmp 545 by Daily Chart view
- Support Zone 485 to 510 Price Band
- Resistance Zone 553 to 581 Price Band
- Falling Resistance Trendline Breakout has well sustained
- Rising Support Trendline well respected by upwards Price Momentum
- Multiple Bullish Rounding Bottoms plus considerate VCP pattern too, as viewed individually
- Support Zone 485 to 510 Price Band
- Resistance Zone 553 to 581 Price Band
- Falling Resistance Trendline Breakout has well sustained
- Rising Support Trendline well respected by upwards Price Momentum
- Multiple Bullish Rounding Bottoms plus considerate VCP pattern too, as viewed individually
免责声明
这些信息和出版物并不意味着也不构成TradingView提供或认可的金融、投资、交易或其它类型的建议或背书。请在使用条款阅读更多信息。
免责声明
这些信息和出版物并不意味着也不构成TradingView提供或认可的金融、投资、交易或其它类型的建议或背书。请在使用条款阅读更多信息。