Go Long @ 918.55 for Targets of 1109.65, 1205.2, 1300.75, and 1491.85 with SL 439.15
Reasons to go Long :
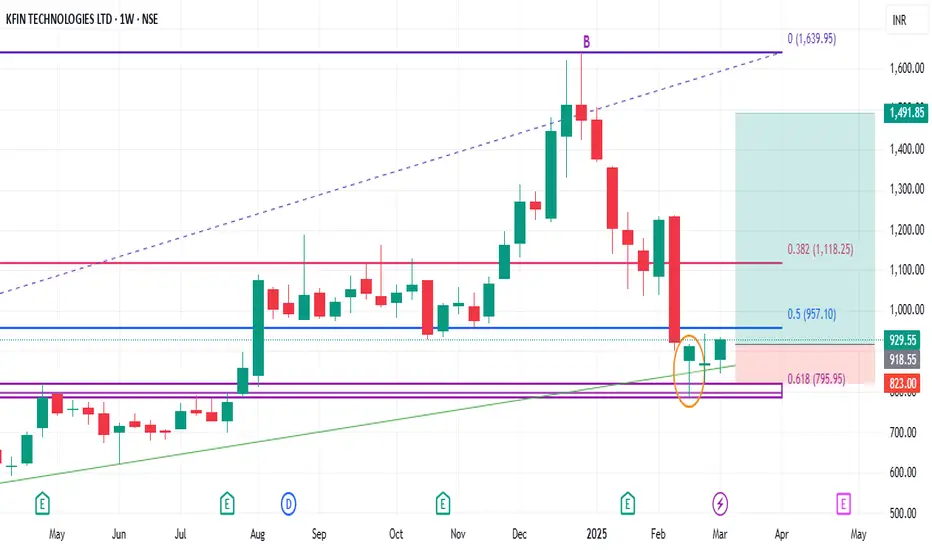
1. On a Weekly timeframe if we draw the Fibonacci retracement tool from the recent swing low (point A) to the recent swing high (point B) then we see stock took support from the 0.618 Fibonacci level.
2. Besides, a bullish candlestick pattern Bullish Hammer (marked with orange) is formed around the 0.618 Fibonacci level.
3. In addition to this there is a strong demand zone (marked with purple) which earlier was acting like resistance but now is providing support to the stock.
4. There is also a strong Trendline (marked with green) that is providing support to the stock.
Reasons to go Long :
1. On a Weekly timeframe if we draw the Fibonacci retracement tool from the recent swing low (point A) to the recent swing high (point B) then we see stock took support from the 0.618 Fibonacci level.
2. Besides, a bullish candlestick pattern Bullish Hammer (marked with orange) is formed around the 0.618 Fibonacci level.
3. In addition to this there is a strong demand zone (marked with purple) which earlier was acting like resistance but now is providing support to the stock.
4. There is also a strong Trendline (marked with green) that is providing support to the stock.
交易开始
交易结束:到达目标
Target 1 Achieved注释
Targets 2 & 3 achieved免责声明
这些信息和出版物并非旨在提供,也不构成TradingView提供或认可的任何形式的财务、投资、交易或其他类型的建议或推荐。请阅读使用条款了解更多信息。
免责声明
这些信息和出版物并非旨在提供,也不构成TradingView提供或认可的任何形式的财务、投资、交易或其他类型的建议或推荐。请阅读使用条款了解更多信息。