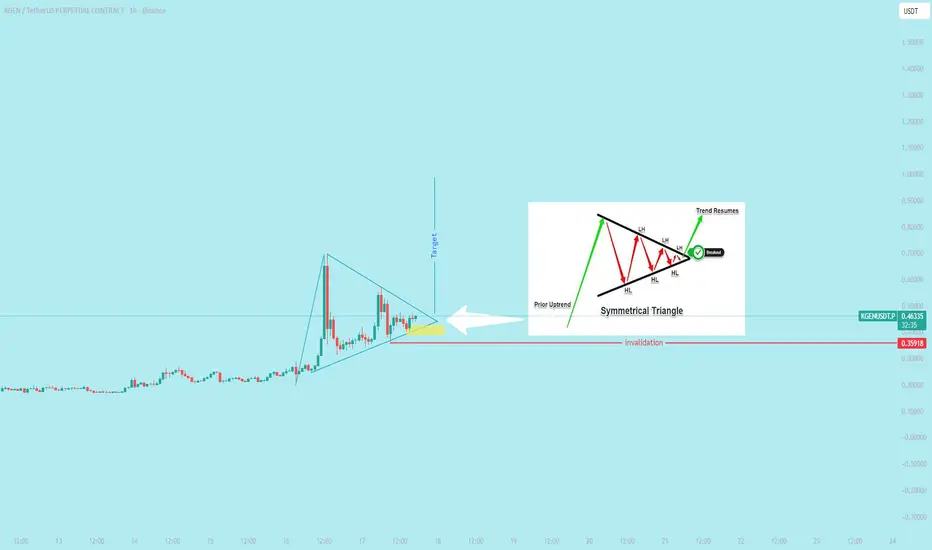
A bullish symmetrical triangle is a continuation pattern that signals a potential resumption of an uptrend. The pattern forms during a period of market indecision, where the price consolidates between a descending upper trendline and an ascending lower trendline. A confirmed breakout above the upper trendline suggests that buyers have regained control and the upward momentum is likely to continue.
免责声明
这些信息和出版物并不意味着也不构成TradingView提供或认可的金融、投资、交易或其它类型的建议或背书。请在使用条款阅读更多信息。
免责声明
这些信息和出版物并不意味着也不构成TradingView提供或认可的金融、投资、交易或其它类型的建议或背书。请在使用条款阅读更多信息。