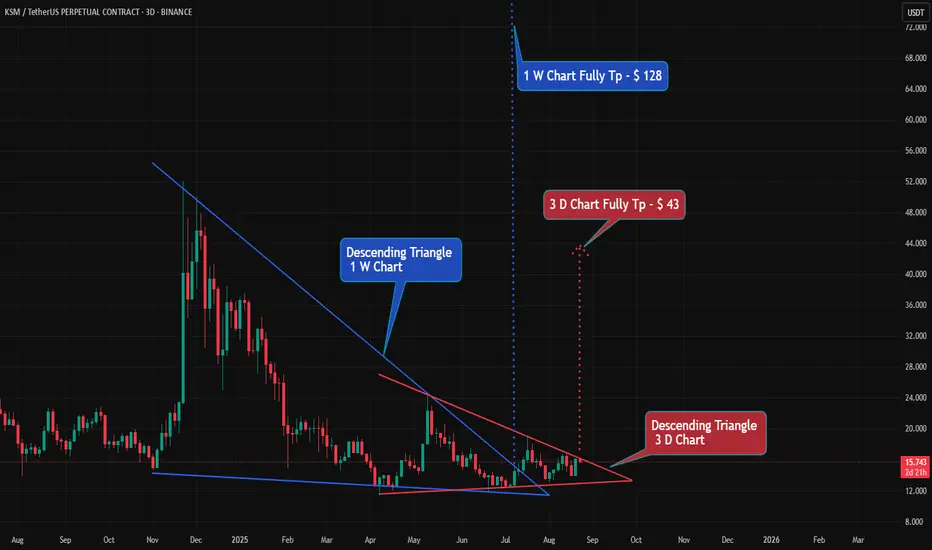
#KSM 1W chart has a Desending tringle pattern that has been broken. 🔼🔼
#KMS Coin is currently forming a Descending Triangle pattern on the 3D chart.
👀 When the market reaches the $723 level, 👀 it shows a double bottom pattern. If it also breaks out, it can rise to $1060.🔼
💵 Tp 1 : $ 443
💵 Tp 2 : $ 499
💵 Tp 3 : $ 575
💵 Tp 4 : $ 723
💵 Tp 5 : $ 1060
#KMS Coin is currently forming a Descending Triangle pattern on the 3D chart.
👀 When the market reaches the $723 level, 👀 it shows a double bottom pattern. If it also breaks out, it can rise to $1060.🔼
💵 Tp 1 : $ 443
💵 Tp 2 : $ 499
💵 Tp 3 : $ 575
💵 Tp 4 : $ 723
💵 Tp 5 : $ 1060
免责声明
这些信息和出版物并不意味着也不构成TradingView提供或认可的金融、投资、交易或其它类型的建议或背书。请在使用条款阅读更多信息。
免责声明
这些信息和出版物并不意味着也不构成TradingView提供或认可的金融、投资、交易或其它类型的建议或背书。请在使用条款阅读更多信息。