Chart Analysis (Daily Timeframe)
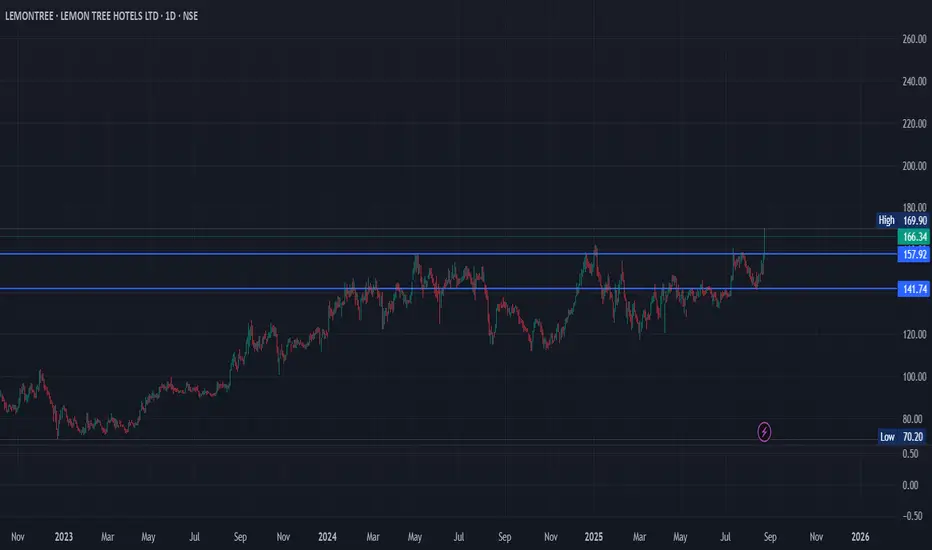
Current Price: ₹166.34 (up +6.92% today with strong volume ~15.5M).
Resistance Zones:
Around ₹157–160 → previously a strong resistance, now broken convincingly.
Next major resistance around ₹170–175 → stock is testing this zone now.
Support Zones:
Immediate support: ₹157.92 (recent breakout level).
Stronger support: ₹141.74 (old base).
Trend: The stock has been in a long consolidation (sideways) for almost a year and just gave a breakout with volume → this is usually a bullish sign.
🟢 Positives
Fresh breakout after long consolidation (a strong bullish pattern).
Volume is very high on the breakout → confirms buying interest.
Structure suggests possibility of a new uptrend if ₹157+ is sustained.
🔴 Risks
Price is near resistance zone (₹170–175). A pullback is possible.
If it falls back below ₹157 with volume, breakout may fail.
✅ Conclusion (Simple)
Good for buying if looking for swing/medium-term.
Ideal entry: On dips near ₹157–160 (with stop-loss below ₹141).
Upside targets: ₹180 → ₹200+ possible in coming months if momentum continues.
Stop-loss: ₹141 (below support).
👉 In short: Stock looks bullish after a long consolidation, but better to buy on dips near ₹157–160 rather than chasing at ₹166-170.
There is no any Buy/Sell recommendation, only for learning purpose as stock market is very risky
免责声明
这些信息和出版物并不意味着也不构成TradingView提供或认可的金融、投资、交易或其它类型的建议或背书。请在使用条款阅读更多信息。
免责声明
这些信息和出版物并不意味着也不构成TradingView提供或认可的金融、投资、交易或其它类型的建议或背书。请在使用条款阅读更多信息。