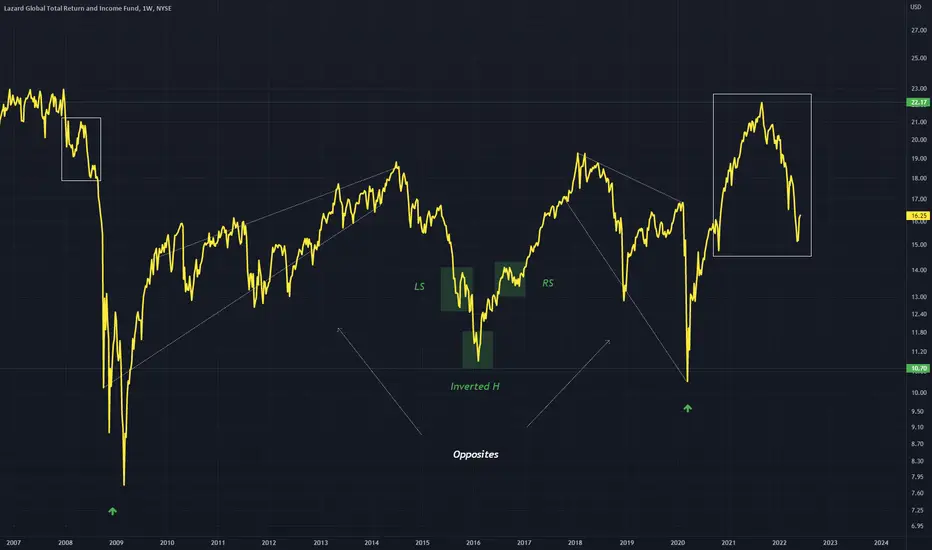
A chart for LGI, price is in a relatively tight range on this Weekly timeframe, it has repeated a chart pattern in an inverted fashion
White rectangle is where we are currently with price and should retest green as it did in the first situation inversely on the first white rectangle
Both are wedge patterns
White rectangle is where we are currently with price and should retest green as it did in the first situation inversely on the first white rectangle
Both are wedge patterns
免责声明
这些信息和出版物并不意味着也不构成TradingView提供或认可的金融、投资、交易或其它类型的建议或背书。请在使用条款阅读更多信息。