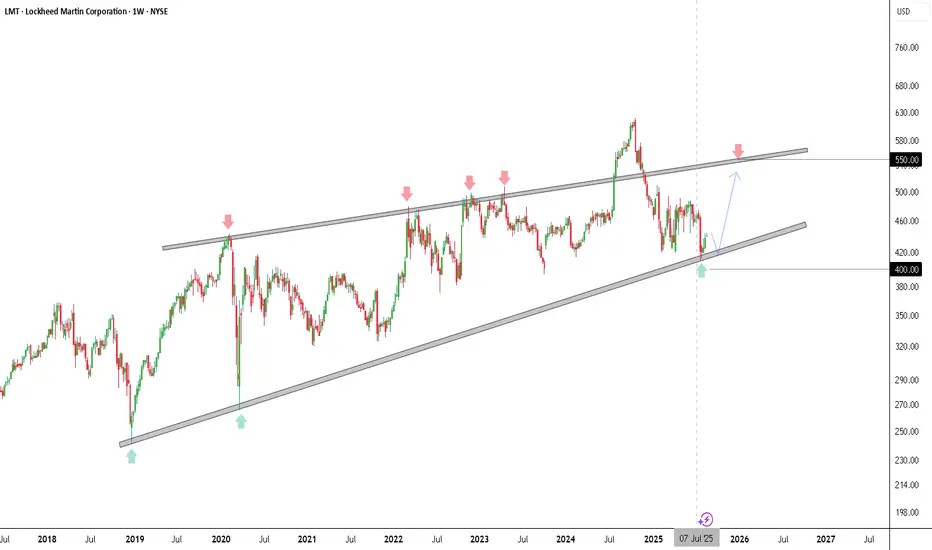
The weekly chart of Lockheed Martin (LMT) shows a well-defined rising wedge pattern, marked by multiple touches on both the upper and lower trendlines over the past several years. Price recently tested the lower trendline around $420–$430, providing a potential support area and signaling a high-probability bounce scenario. This aligns with previous historical reactions, as seen in similar touches in 2019 and 2020.
The chart suggests a potential upward move toward the upper trendline near $550, pending confirmation. Traders should watch for bullish candlestick formations or price action signals around the lower trendline to validate the entry.
Trade Setup:
Entry: Long around $430 after confirmation of support bounce.
Target Profit (TP): $550, coinciding with upper trendline resistance.
Stop Loss (SL): $400, slightly below the lower trendline to mitigate downside risk.
Timeframe: Weekly chart; ideal for swing trading.
Confirmation: Monitor for strong weekly green candles, bullish engulfing patterns, or accumulation volume signals near support.
The rising wedge pattern indicates that as long as the lower trendline holds, the bias remains bullish in the medium term. However, a decisive breakdown below $400 would invalidate this setup and signal potential deeper correction.
免责声明
这些信息和出版物并非旨在提供,也不构成TradingView提供或认可的任何形式的财务、投资、交易或其他类型的建议或推荐。请阅读使用条款了解更多信息。