LSI Trendline
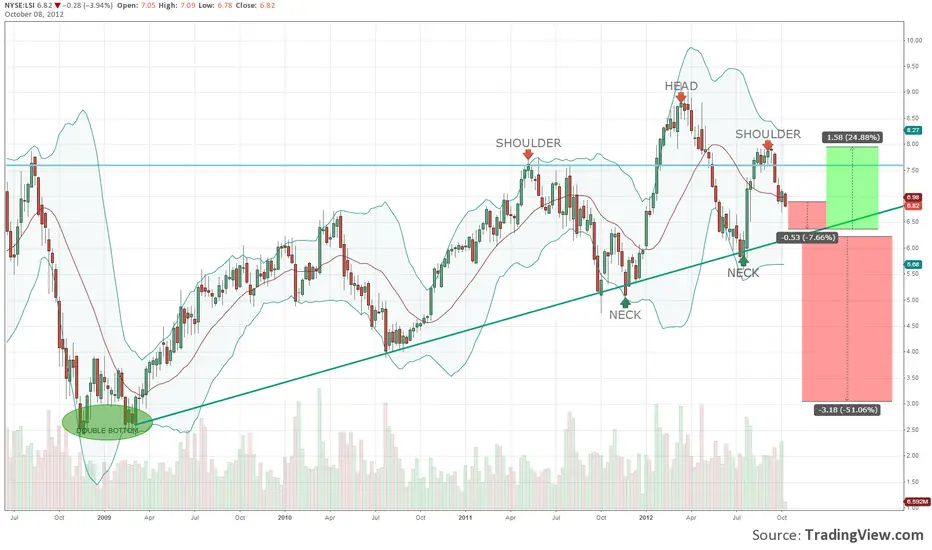
LSI is coming against its longterm trendline. We have about another $0.50 down until a decision has to be made. On one hand we could see a bounce back off the trendline if it can be held. However, the most recent high was lower than the previous high, creating a head and shoulders pattern. The distance from the neckline to the top of the head is about $3.20, which means that if we see the neckline broken, there could be around a 50% loss on the value of the stock.
免责声明
这些信息和出版物并不意味着也不构成TradingView提供或认可的金融、投资、交易或其它类型的建议或背书。请在使用条款阅读更多信息。
免责声明
这些信息和出版物并不意味着也不构成TradingView提供或认可的金融、投资、交易或其它类型的建议或背书。请在使用条款阅读更多信息。