On 8th September, M&M broke the previous day’s high and rallied nearly 4%. However, it soon entered a gradual downtrend on the hourly timeframe, holding the ₹3575 level (the high of 5th September, now acting as support).
After a day of consolidation, the stock broke below ₹3575 and closed beneath it. In the following session, it faced resistance at the same level but later broke above it again, suggesting a false breakout.
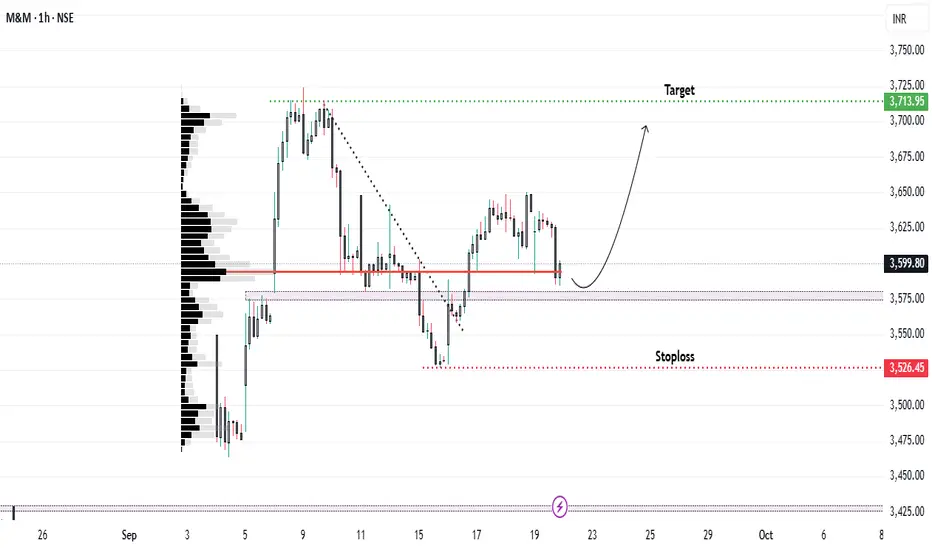
Currently, the stock is retesting this zone. The Volume Profile indicator shows a significant high-volume cluster around ₹3600, adding importance to this level.
📊 Trade Setup
* Entry: ₹3585
* Target: ₹3700 (recent swing high)
* Stoploss: ₹3526
⚠️ Note
Due to uncertainty around the US-India trade deal and developments in the auto sector, volatility may increase. Trade cautiously and manage risk effectively.
After a day of consolidation, the stock broke below ₹3575 and closed beneath it. In the following session, it faced resistance at the same level but later broke above it again, suggesting a false breakout.
Currently, the stock is retesting this zone. The Volume Profile indicator shows a significant high-volume cluster around ₹3600, adding importance to this level.
📊 Trade Setup
* Entry: ₹3585
* Target: ₹3700 (recent swing high)
* Stoploss: ₹3526
⚠️ Note
Due to uncertainty around the US-India trade deal and developments in the auto sector, volatility may increase. Trade cautiously and manage risk effectively.
免责声明
这些信息和出版物并不意味着也不构成TradingView提供或认可的金融、投资、交易或其它类型的建议或背书。请在使用条款阅读更多信息。
免责声明
这些信息和出版物并不意味着也不构成TradingView提供或认可的金融、投资、交易或其它类型的建议或背书。请在使用条款阅读更多信息。