Overview -
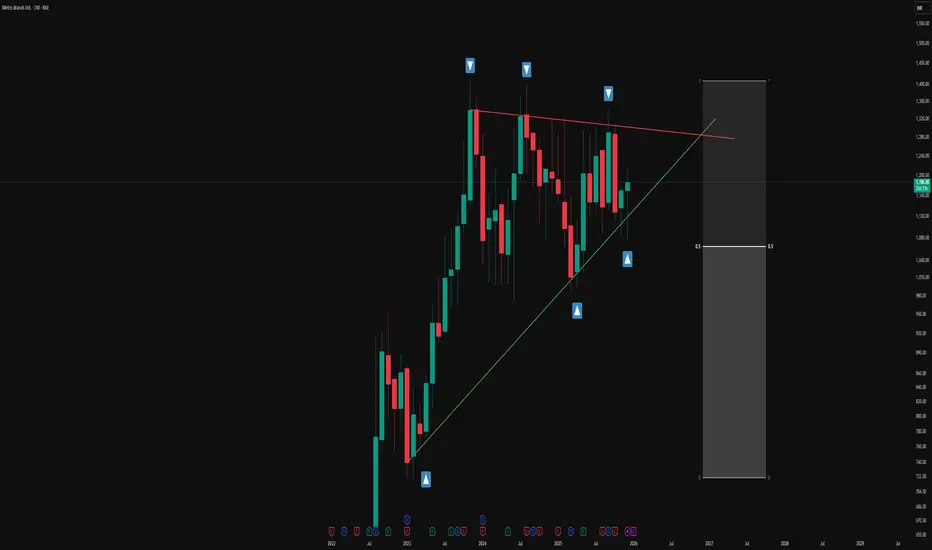
This monthly chart illustrates a symmetrical triangle pattern defined by a series of higher lows and relatively stable swing highs, framed by a green ascending trendline and a red counter-trendline. The structure is presented in an observational manner to highlight how price has evolved within these converging boundaries over an extended period.
Triangle structure -
1.The green line represents the primary trendline, drawn from successive higher swing lows where price has repeatedly found support and turned back up. Each time price touches or approaches this green line, the contact is marked with a blue upward arrow box to emphasize how buyers have consistently responded around this rising level. Together, these points of contact visually document the stepping pattern of higher lows that contributes to the lower boundary of the triangle.
2.The red line acts as the counter-trendline, connecting multiple prominent swing highs where upward movement has stalled and reversed. Blue downward arrow boxes are placed at these touchpoints to highlight how price has respected this sloping resistance zone over time. The repeated interaction with the red line shows how sellers have been active around this upper boundary, creating a series of contained pushes to the upside.
Understanding -
The overall construction emphasizes how multiple touches on both the trendline (T) and counter-trendline (CT) are used to validate the presence of this symmetrical triangle. Rather than focusing on any single candle, the chart showcases the cumulative behaviour of price over many months, making it a useful visual example for studying how support and resistance can evolve into a geometric pattern on a higher time frame.
Disclaimer: This description is purely educational and observational, intended to explain chart structure and pattern formation. It does not constitute investment advice, trade recommendations, or any suggestion to buy, sell, or hold any financial instrument.
🎯 Master My Self-Made Trading Strategy
📈 Telegram (Learn Today): t.me/hashtaghammer
✅ WhatsApp (Learn Today): wa.me/919455664601
📈 Telegram (Learn Today): t.me/hashtaghammer
✅ WhatsApp (Learn Today): wa.me/919455664601
相关出版物
免责声明
这些信息和出版物并非旨在提供,也不构成TradingView提供或认可的任何形式的财务、投资、交易或其他类型的建议或推荐。请阅读使用条款了解更多信息。