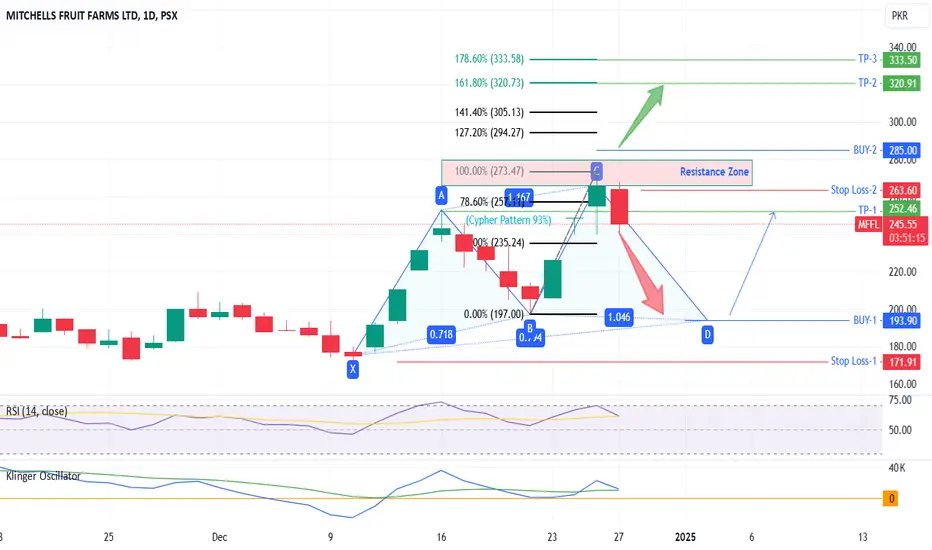
MFFL on daily TF, price has started to move downwards. It is following Cypher pattern and 93% chances are that it will follow it till price drops to 193~195. Additionally, RSI has also dipped close to 60 level and still going downwards. KVO also is dipping downwards but still above zero line; as soon as Blue line downwards crosses Green line price will start to drop sharply. If KVO dips below zero then selling pressure will be enormous.
Therefore, a cautious approach should be followed while getting in to it.
My recommendations would be to buy at dip of 193 and that too after analyzing it again as it may even slip to 120~130.
Alternatively, buying after it crosses 290 will be better approach as then it will be in the next bull run leg. TPs are calculated on Fib based Ext tool.
Trade Values have been marked on the chart.
免责声明
这些信息和出版物并不意味着也不构成TradingView提供或认可的金融、投资、交易或其它类型的建议或背书。请在使用条款阅读更多信息。
免责声明
这些信息和出版物并不意味着也不构成TradingView提供或认可的金融、投资、交易或其它类型的建议或背书。请在使用条款阅读更多信息。