Let's start by looking at the weekly timeframe chart...

➖ An ATH was hit in July but the candle in which the ATH hit closed red and this preceded a correction.
➖ A new All-Time High hit last month with the candle again closing red, which opens the door for a new but stronger correction. These are early signals.
➖ The weekly RSI is showing a 2 year strong bearish divergence, it peaked November 2021 while the stock peaked November 2023.

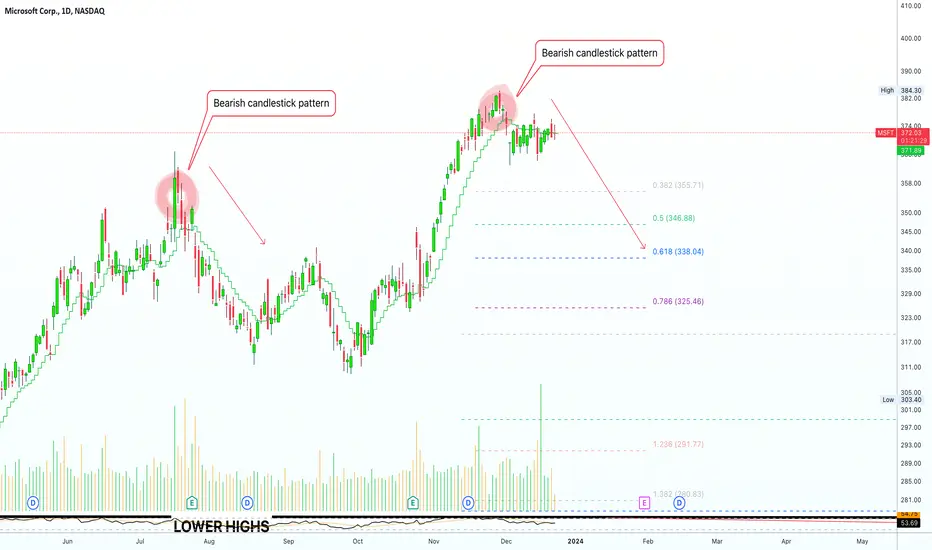
➖ On the daily timeframe MSFT still trades above EMA10 but a recent bearish candlestick pattern showed up after the new ATH.
➖ We have really high buy volume 15-Dec but prices failed to move higher, a sign of weakness.
There is potential for a drop.
Additional confirmation is needed, is still very early but the bullish trend is losing momentum.
Namaste.
➖ An ATH was hit in July but the candle in which the ATH hit closed red and this preceded a correction.
➖ A new All-Time High hit last month with the candle again closing red, which opens the door for a new but stronger correction. These are early signals.
➖ The weekly RSI is showing a 2 year strong bearish divergence, it peaked November 2021 while the stock peaked November 2023.
➖ On the daily timeframe MSFT still trades above EMA10 but a recent bearish candlestick pattern showed up after the new ATH.
➖ We have really high buy volume 15-Dec but prices failed to move higher, a sign of weakness.
There is potential for a drop.
Additional confirmation is needed, is still very early but the bullish trend is losing momentum.
Namaste.
🚨 LIFETIME (Pay 1, Get 7)
lamatrades.com —Since 2017
🚨 Results
ETH +2150%
CRO +1272%
AAVE +1134%
DOGS +868%
SOL +861%
XRP +749%
BTC +580%
t.me/masteranandatrades/6681
😱 Wow & New Results
t.me/anandatrades/1350
lamatrades.com —Since 2017
🚨 Results
ETH +2150%
CRO +1272%
AAVE +1134%
DOGS +868%
SOL +861%
XRP +749%
BTC +580%
t.me/masteranandatrades/6681
😱 Wow & New Results
t.me/anandatrades/1350
相关出版物
免责声明
这些信息和出版物并不意味着也不构成TradingView提供或认可的金融、投资、交易或其它类型的建议或背书。请在使用条款阅读更多信息。