Divergence indication signals suggest bullish change in momentum.
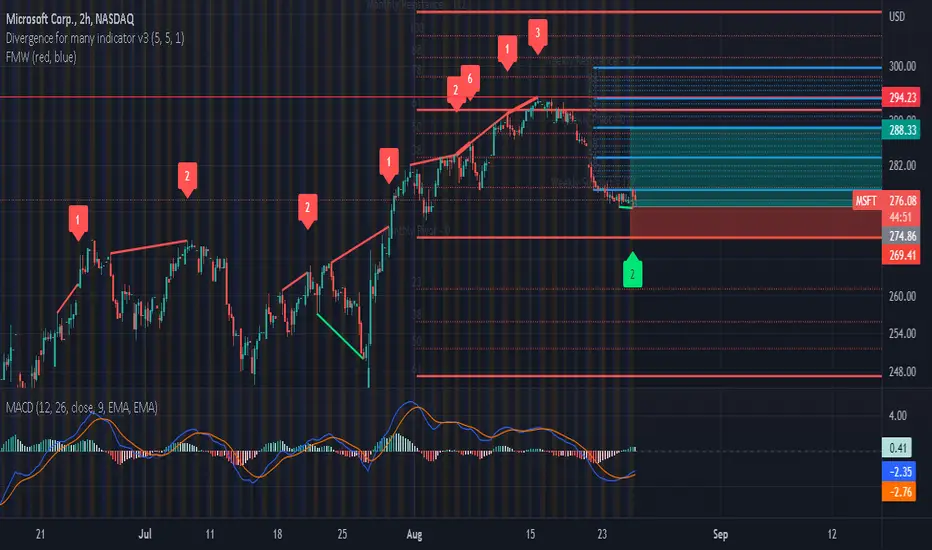
Candlestick momentum shows an inverted hammer signal. The underlying stock price presented in the form of candlesticks seems to be stabilizing in line with its strong weekly support level. This suggests that the bareish sentiment is changing and loosing momentum. Inverted hammer, whist not as reliable as a Hammers, still certainly suggest that bullish momentum is likely.
When applying a weekly and monthly ranged Fibonacci, investors can see that this inverted hammer is occurring in line with its strong 1.00 support level. However, when looking at the 1-month ranged Fibonacci investors are wary given that the stock is trading in line with it’s weaker 0.22 resistance level.
It´s important to consider that the end of July and August has seen bullish rallies. The underlying stock value of MSFT has risen above 10%. This was after bearish momentum that began on 16/08/22. Before this underlying stock prices had risen as much as 20% between 26/07/22 and 15/08/22.
All things considered, we are bullish in sentiment. We anticipate the price of MSFT to reach it´s weekly central 0.00 Fibonacci pivot.
💥 Free signals and ideas ➡ t.me/vfinvestment
免责声明
这些信息和出版物并非旨在提供,也不构成TradingView提供或认可的任何形式的财务、投资、交易或其他类型的建议或推荐。请阅读使用条款了解更多信息。
💥 Free signals and ideas ➡ t.me/vfinvestment
免责声明
这些信息和出版物并非旨在提供,也不构成TradingView提供或认可的任何形式的财务、投资、交易或其他类型的建议或推荐。请阅读使用条款了解更多信息。