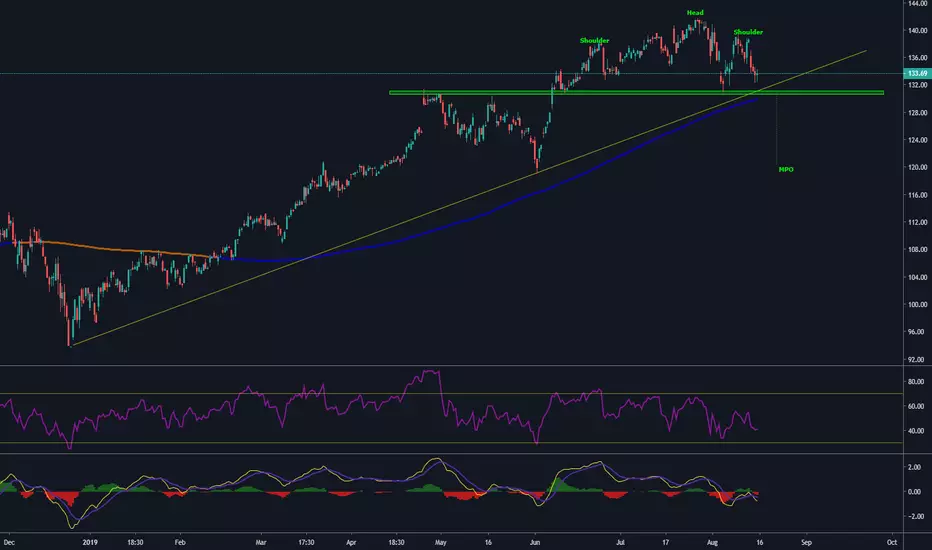
Chart analysis shows H&S pattern forming with divergence on both MACD and RSI. MPO target $120 support area and 200SMA on a daily chart (see in comments). First needs a good break through the trend line and 200SMA, quite strong support area around $130 level. If the market sell off continues next week, it could be the trigger for the pattern.
On the fundamental side major banks and investment funds see the stock as 'neutral-buy' and split price targets ranging from $115 to $160. Good Luck!
On the fundamental side major banks and investment funds see the stock as 'neutral-buy' and split price targets ranging from $115 to $160. Good Luck!
注释
免责声明
这些信息和出版物并非旨在提供,也不构成TradingView提供或认可的任何形式的财务、投资、交易或其他类型的建议或推荐。请阅读使用条款了解更多信息。
免责声明
这些信息和出版物并非旨在提供,也不构成TradingView提供或认可的任何形式的财务、投资、交易或其他类型的建议或推荐。请阅读使用条款了解更多信息。