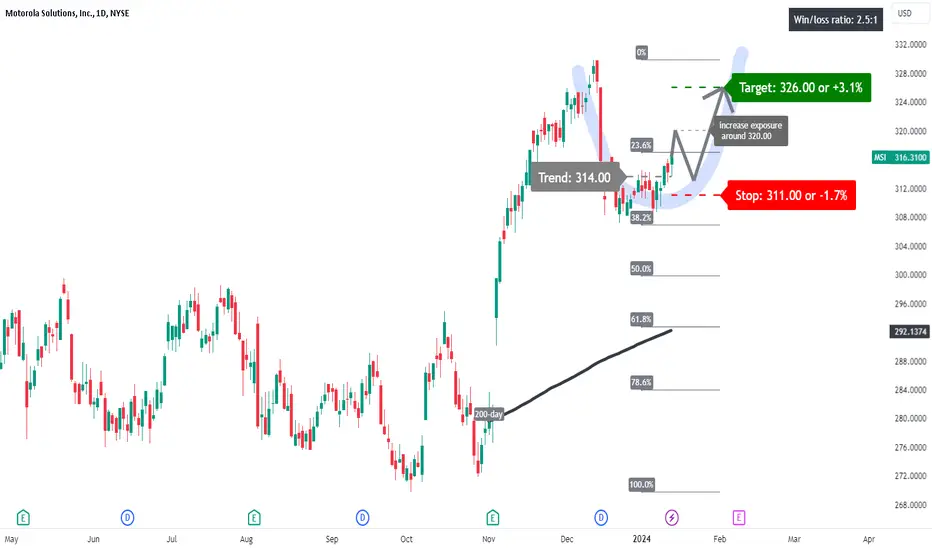
A price action above 314.00 supports a bullish trend direction.
Expect further upside potential for a break above 320.00.
The target price is set at 326.00.
The stop-loss price is set at 311.00.
The U-shaped pattern observed in the price chart may imply a potential for further upward movement in prices. This pattern, often seen as a sign of market recovery or bullish sentiment, suggests that after a period of decline or consolidation, there is a likelihood of price increases as the pattern completes its formation and trends upwards
免责声明
这些信息和出版物并非旨在提供,也不构成TradingView提供或认可的任何形式的财务、投资、交易或其他类型的建议或推荐。请阅读使用条款了解更多信息。
免责声明
这些信息和出版物并非旨在提供,也不构成TradingView提供或认可的任何形式的财务、投资、交易或其他类型的建议或推荐。请阅读使用条款了解更多信息。