🔎 Pattern Analysis
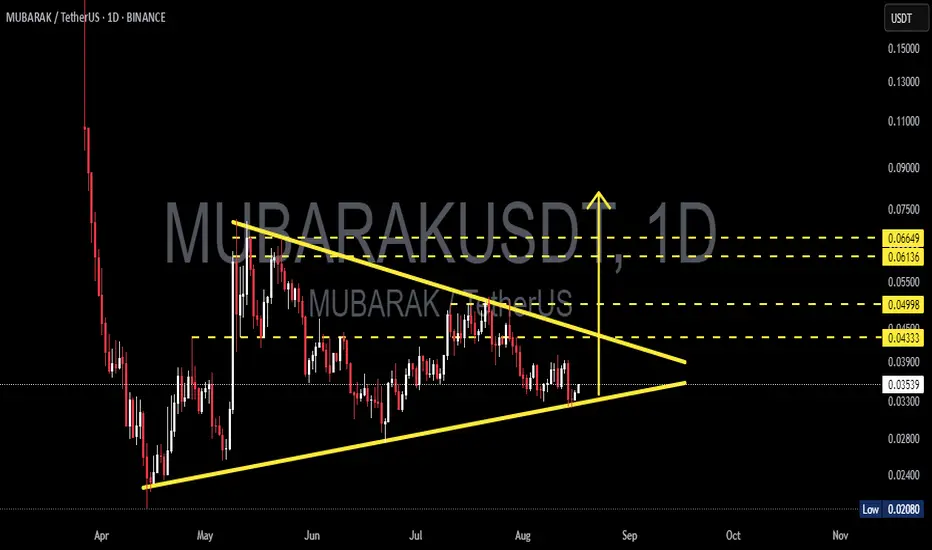
MUBARAKUSDT is currently consolidating inside a Symmetrical Triangle. This structure is formed by a series of lower highs (decreasing selling pressure) and higher lows (increasing buying pressure), showing that the market is coiling up energy for the next decisive move.
👉 As price approaches the apex, volatility tends to shrink, but the probability of a strong breakout increases significantly.
📌 Key Levels
Major support: 0.03531 – 0.03330
Apex zone (neutral area): 0.03900
Resistance levels to watch: 0.04333 – 0.04998 – 0.06136 – 0.06649
Downside supports if breakdown occurs: 0.02800 – 0.02400 – 0.02080 (historical low)
---
🚀 Bullish Scenario
1. Trigger: A daily close above the upper trendline and breakout confirmation above 0.0390.
2. Momentum: If accompanied by strong volume, the breakout could lead to an explosive rally as traders and algorithms enter positions.
3. Upside targets:
🎯 T1: 0.0433 (immediate supply area)
🎯 T2: 0.0500 (psychological & horizontal resistance)
🎯 T3: 0.0613 – 0.0665 (major supply zone & potential FOMO region)
4. Psychological note: A breakout from a symmetrical triangle often triggers short squeezes, accelerating upward momentum.
---
🐻 Bearish Scenario
1. Trigger: A daily close below 0.0333 and breakdown of the rising trendline.
2. Momentum: High selling volume would signal bearish dominance, especially if the broader crypto market sentiment is weak.
3. Downside targets:
🎯 S1: 0.0280
🎯 S2: 0.0240
🎯 S3: 0.0208 (major historical low and last line of buyer defense)
4. Psychological note: Losing 0.0333 could trigger mass stop-loss cascades, adding selling pressure.
---
📖 Pattern Notes
Symmetrical triangles are neutral continuation/consolidation patterns — direction is determined only after a valid breakout.
The longer the consolidation, the stronger the energy stored inside the pattern → usually leading to a powerful breakout.
Until confirmation, traders often use range-trading strategies (buy near lower TL, sell near upper TL) but with increasing whipsaw risks closer to the apex.
---
📌 Conclusion
MUBARAKUSDT is entering a make-or-break zone.
A confirmed breakout above 0.0390 could open the path toward 0.0433 – 0.0665.
A confirmed breakdown below 0.0333 could push price all the way to 0.0208.
⚠️ Always monitor volume and daily close for confirmation — fake breakouts remain a key risk in this type of setup.
#MUBARAKUSDT #MUBARAK #CryptoAnalysis #PriceAction #SymmetricalTriangle #ChartPattern #BreakoutTrading #TechnicalAnalysis #CryptoSetup #RiskManagement
✅ Get Free Signals! Join Our Telegram Channel Here: t.me/TheCryptoNuclear
✅ Twitter: twitter.com/crypto_nuclear
✅ Join Bybit : partner.bybit.com/b/nuclearvip
✅ Benefits : Lifetime Trading Fee Discount -50%
✅ Twitter: twitter.com/crypto_nuclear
✅ Join Bybit : partner.bybit.com/b/nuclearvip
✅ Benefits : Lifetime Trading Fee Discount -50%
免责声明
这些信息和出版物并不意味着也不构成TradingView提供或认可的金融、投资、交易或其它类型的建议或背书。请在使用条款阅读更多信息。