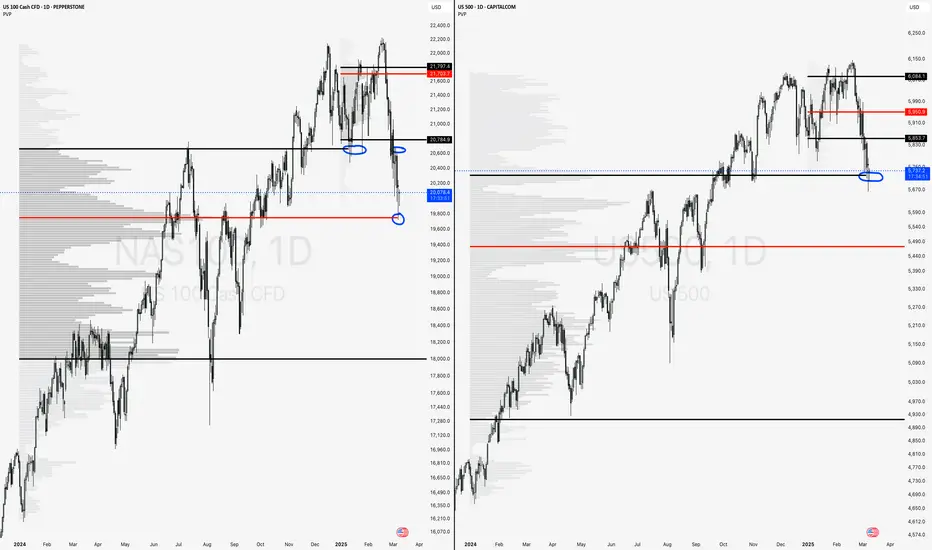
The charts shown are highlighting the 12 month periodic volume profile chart. Currently, the S&P 500 and Nasdaq 100 are bouncing off major 2024 value areas.
Nasdaq 100:
Last week we can see how bulls lost the 2024 value area high (VAH) and couldn't reclaim. As a result we swiftly moved down to the point of control (POC) where we found buyers show up.
S&P 500:
Coincidently, the S&P 500 moved down to the 2024 VAH where it also found buyers show up.
Moving Forward:
These areas remain very important and should be monitored going forward. If a bounce is to happen here, bulls would like to see the Nasdaq reclaim the 2024 VAH and even work back into the current 2025 VAL.
免责声明
这些信息和出版物并不意味着也不构成TradingView提供或认可的金融、投资、交易或其它类型的建议或背书。请在使用条款阅读更多信息。
免责声明
这些信息和出版物并不意味着也不构成TradingView提供或认可的金融、投资、交易或其它类型的建议或背书。请在使用条款阅读更多信息。