NASDAQ Potential Bearish Reversal Analysis 🧠🔻
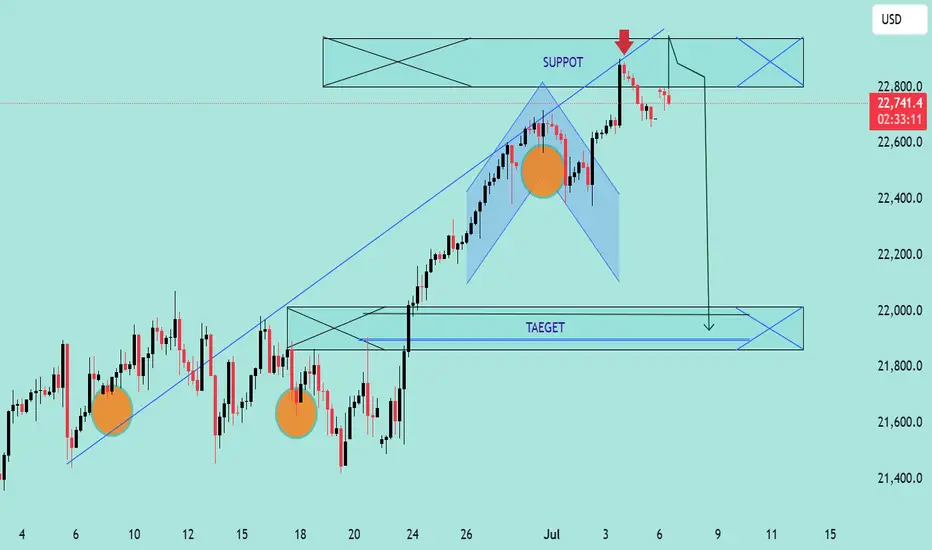
The chart illustrates a potential bearish setup forming after a recent uptrend in NASDAQ. Let's break it down professionally:
🔍 Technical Overview:
Ascending Trendline Break ✅
Price had been respecting a steady ascending trendline.
A break below this trendline indicates a possible momentum shift from bullish to bearish.
Bearish Pattern Formation 🔷
A bearish flag/pennant-like formation can be observed after the sharp rise.
This consolidation followed by a breakdown could be a continuation pattern, hinting at further downside.
Resistance Rejection 🔴
A red arrow marks a clear rejection from the resistance zone near 22,800 USD.
Strong wick rejections and bearish candles suggest selling pressure at that level.
Support Turned Resistance (SUPPOT 🛑)
The previously broken support zone is now acting as resistance (note: "SUPPOT" appears misspelled—should be "SUPPORT").
Bearish Target Zone 🎯
The chart marks a "TAEGET" zone (should be "TARGET") near the 21,900 – 22,000 USD range.
This aligns with prior consolidation and demand zones, making it a likely area for price to retrace.
📌 Key Zones:
Resistance (Rejection Area): 22,800 USD
Current Price: 22,739.7 USD
Bearish Target Zone: 21,900 – 22,000 USD
⚠️ Conclusion:
The market shows signs of a bearish reversal with a confirmed trendline break, resistance rejection, and bearish pattern formation. If the price fails to reclaim the 22,800 level, there’s a high probability of downward continuation toward the 22,000 target.
🧠🔻
The chart illustrates a potential bearish setup forming after a recent uptrend in NASDAQ. Let's break it down professionally:
🔍 Technical Overview:
Ascending Trendline Break ✅
Price had been respecting a steady ascending trendline.
A break below this trendline indicates a possible momentum shift from bullish to bearish.
Bearish Pattern Formation 🔷
A bearish flag/pennant-like formation can be observed after the sharp rise.
This consolidation followed by a breakdown could be a continuation pattern, hinting at further downside.
Resistance Rejection 🔴
A red arrow marks a clear rejection from the resistance zone near 22,800 USD.
Strong wick rejections and bearish candles suggest selling pressure at that level.
Support Turned Resistance (SUPPOT 🛑)
The previously broken support zone is now acting as resistance (note: "SUPPOT" appears misspelled—should be "SUPPORT").
Bearish Target Zone 🎯
The chart marks a "TAEGET" zone (should be "TARGET") near the 21,900 – 22,000 USD range.
This aligns with prior consolidation and demand zones, making it a likely area for price to retrace.
📌 Key Zones:
Resistance (Rejection Area): 22,800 USD
Current Price: 22,739.7 USD
Bearish Target Zone: 21,900 – 22,000 USD
⚠️ Conclusion:
The market shows signs of a bearish reversal with a confirmed trendline break, resistance rejection, and bearish pattern formation. If the price fails to reclaim the 22,800 level, there’s a high probability of downward continuation toward the 22,000 target.
🧠🔻
The chart illustrates a potential bearish setup forming after a recent uptrend in NASDAQ. Let's break it down professionally:
🔍 Technical Overview:
Ascending Trendline Break ✅
Price had been respecting a steady ascending trendline.
A break below this trendline indicates a possible momentum shift from bullish to bearish.
Bearish Pattern Formation 🔷
A bearish flag/pennant-like formation can be observed after the sharp rise.
This consolidation followed by a breakdown could be a continuation pattern, hinting at further downside.
Resistance Rejection 🔴
A red arrow marks a clear rejection from the resistance zone near 22,800 USD.
Strong wick rejections and bearish candles suggest selling pressure at that level.
Support Turned Resistance (SUPPOT 🛑)
The previously broken support zone is now acting as resistance (note: "SUPPOT" appears misspelled—should be "SUPPORT").
Bearish Target Zone 🎯
The chart marks a "TAEGET" zone (should be "TARGET") near the 21,900 – 22,000 USD range.
This aligns with prior consolidation and demand zones, making it a likely area for price to retrace.
📌 Key Zones:
Resistance (Rejection Area): 22,800 USD
Current Price: 22,739.7 USD
Bearish Target Zone: 21,900 – 22,000 USD
⚠️ Conclusion:
The market shows signs of a bearish reversal with a confirmed trendline break, resistance rejection, and bearish pattern formation. If the price fails to reclaim the 22,800 level, there’s a high probability of downward continuation toward the 22,000 target.
JOIN MY TELEGRAM CHANNEL
t.me/StellarMarketAnalysis
JOIN MY RECOMMENTED BROKER REFFREL LINK
⤵️one.exnesstrack.net/a/uvd1etcgg1
PARTNER CODE⤵️
uvd1etcgg1
t.me/StellarMarketAnalysis
JOIN MY RECOMMENTED BROKER REFFREL LINK
⤵️one.exnesstrack.net/a/uvd1etcgg1
PARTNER CODE⤵️
uvd1etcgg1
免责声明
这些信息和出版物并不意味着也不构成TradingView提供或认可的金融、投资、交易或其它类型的建议或背书。请在使用条款阅读更多信息。