*Due to the platform's features, the charts are arranged in sequence from left to right, from the first to the Eighth chart. The charts were created by our team and based on an analysis from Bloomberg and the EIA data.
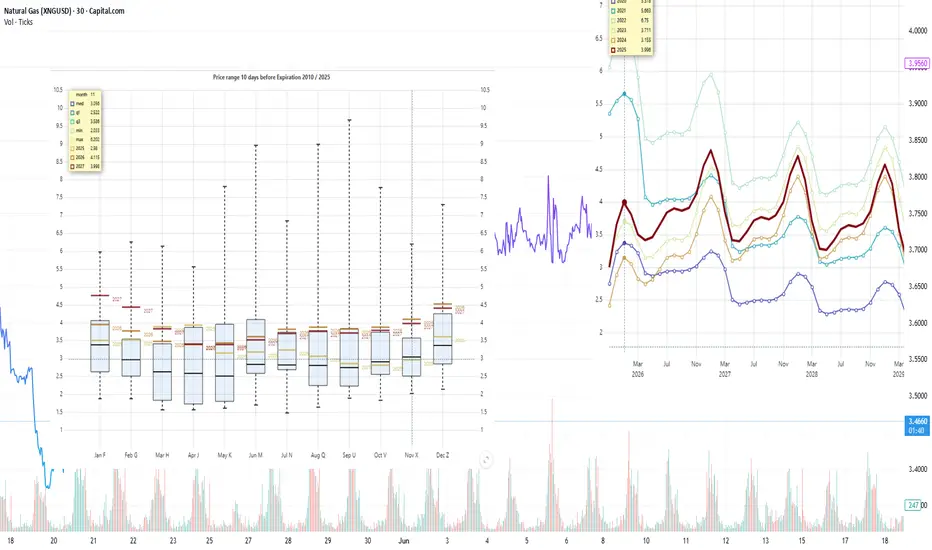
Current prices compared to price dispersion 10 days before expiration by month since 2010
[Chart-1]
Due to warm weather and high production, the NGX25 contract is trading below its 10-day average and showing increased volatility during this period. Prices for 2026 winter contracts remain above the upper limit of the interquartile range.
Forward curve compared to 2020-2025
[Chart-2]
The shape of the forward curve in 2025 shows a steady convergence and is even closer to the configurations recorded in 2023 and 2024 for comparable dates. This trend is particularly evident in contracts with delivery in three years or more, where prices are steadily converging towards historical levels.
Current stocks and forecast for next week compared to 2019-2024
[Chart-3]
According to the forecast for week 41 (October 6-12), gas reserves in underground storage facilities will increase by +87 BCF, reaching 3728 BCF, which exceeds the figure for the same period last year. The growth in reserves is supported by high production volumes and mild weather conditions.
14-day sliding sum HDD+CDD based on current NOAA data and forecast for the next two weeks compared to 1994-2024
[Chart-4]
The HDD+CDD accumulated over 14 days for all regions remains below the historical averages for 1994–2024, and even taking into account the forecast for the next two weeks, no significant deviation from the current trend of mild weather is expected.
14-day sliding sum of HDD+CDD based on current NOAA data and forecast for the next two weeks compared to 1994-2024 by region
[Chart-5]
In all regions except WS CENTRAL and PACIFIC, the 14-day cumulative HDD+CDD remains below the historical average for 1994–2024, and the forecast for the next two weeks does not suggest a departure from the current mild weather trend.
Weekly total supply/demand difference compared to 2014-2024
[Chart-6]
This week, the difference between supply and demand in 2025 is below the average values for 2014–2024, indicating weaker demand or excess supply.
Number of days for delivery from warehouses
[Chart-7]
The graph shows the number of days of supply from storage facilities alone, based on current consumption levels. By early October 2025, reserves will last for approximately 35 days, which is below the lower limit of the interquartile range. With such moderate reserves, even minor disruptions in production or spikes in demand could cause sharp price reactions, especially in late winter and early spring.
Anomalies in weather (HDD+CDD) and fundamental factors
[Chart-8]
Overall, fundamental factors and weather anomalies are within the expected range, with no systemic deviations. We do not expect significant price deviations in the current expiration period unless there are radical changes in supply and demand due to weather, production, or export factors.
*This analysis was conducted in cooperation with Anastasia Volkova, analyst of LSE.
Head of Analytics Center at the European broker Mind-Money.eu
👉 mind-money.eu
Website
👉 igorisaev.com/
👉 mind-money.eu
Website
👉 igorisaev.com/
免责声明
这些信息和出版物并不意味着也不构成TradingView提供或认可的金融、投资、交易或其它类型的建议或背书。请在使用条款阅读更多信息。
Head of Analytics Center at the European broker Mind-Money.eu
👉 mind-money.eu
Website
👉 igorisaev.com/
👉 mind-money.eu
Website
👉 igorisaev.com/
免责声明
这些信息和出版物并不意味着也不构成TradingView提供或认可的金融、投资、交易或其它类型的建议或背书。请在使用条款阅读更多信息。