Hello, I hope you're doing well today. We are going to analyze the Nasdaq index together. The Nasdaq is one of the key U.S. stock indices and consistently offers promising trading opportunities. If you're ready, let's dive into the analysis.
Timeframe: 4H / Daily
🔍 Market Structure Overview
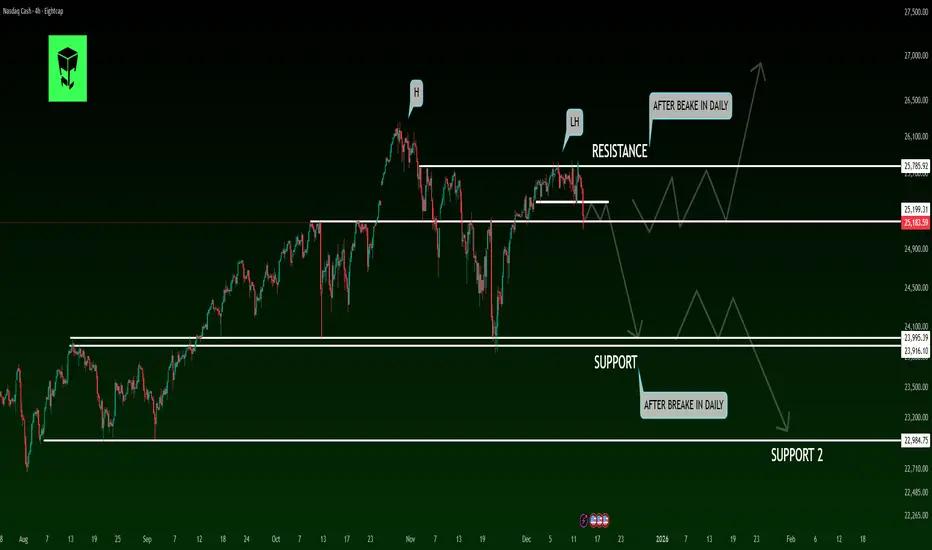
After forming a major High (H) followed by a clear Lower High (LH) near a key resistance zone, the NASDAQ index is showing signs of bullish momentum weakness. Failure to hold and stabilize above this resistance increases the probability of a market phase shift from bullish/ranging to corrective or bearish.
🧱 Key Supply & Demand Zones
🔴 Major Resistance:
Area around 25,750 – 25,900
This zone has rejected price multiple times and is acting as a strong supply area.
🟢 First Support:
Area around 23,950 – 24,050
A daily close below this support would strengthen the bearish scenario.
🟢 Second Support (Support 2):
Area around 22,900 – 23,000
A potential downside target if the first support breaks and weakness continues.
⚠️ Probable Market Scenario
As long as price remains below the main resistance,
the corrective / bearish scenario remains dominant.
A confirmed daily break below the first support could trigger
accelerated selling toward Support 2.
Any bullish moves at this stage may be considered pullbacks into resistance,
rather than the start of a new uptrend.
🧠 Summary
📌 Market structure suggests a weak trend
📌 Sellers are showing strength near highs
📌 Extra caution is required for long positions
📌 Short trades are more favorable only after confirmed breaks
🛑 Disclaimer
⚠️ This analysis is for educational purposes only
⚠️ It is NOT financial advice
⚠️ All trading decisions are made at your own risk
⚠️ Always apply proper risk and capital management
📊 Poll – What’s your outlook?
❓ What do you expect next for NASDAQ?
🔘 Further decline toward lower supports 📉
🔘 Range-bound movement between support & resistance 🔄
🔘 Strong rebound and breakout above resistance 🚀
👇 Share your view in the comments
Timeframe: 4H / Daily
🔍 Market Structure Overview
After forming a major High (H) followed by a clear Lower High (LH) near a key resistance zone, the NASDAQ index is showing signs of bullish momentum weakness. Failure to hold and stabilize above this resistance increases the probability of a market phase shift from bullish/ranging to corrective or bearish.
🧱 Key Supply & Demand Zones
🔴 Major Resistance:
Area around 25,750 – 25,900
This zone has rejected price multiple times and is acting as a strong supply area.
🟢 First Support:
Area around 23,950 – 24,050
A daily close below this support would strengthen the bearish scenario.
🟢 Second Support (Support 2):
Area around 22,900 – 23,000
A potential downside target if the first support breaks and weakness continues.
⚠️ Probable Market Scenario
As long as price remains below the main resistance,
the corrective / bearish scenario remains dominant.
A confirmed daily break below the first support could trigger
accelerated selling toward Support 2.
Any bullish moves at this stage may be considered pullbacks into resistance,
rather than the start of a new uptrend.
🧠 Summary
📌 Market structure suggests a weak trend
📌 Sellers are showing strength near highs
📌 Extra caution is required for long positions
📌 Short trades are more favorable only after confirmed breaks
🛑 Disclaimer
⚠️ This analysis is for educational purposes only
⚠️ It is NOT financial advice
⚠️ All trading decisions are made at your own risk
⚠️ Always apply proper risk and capital management
📊 Poll – What’s your outlook?
❓ What do you expect next for NASDAQ?
🔘 Further decline toward lower supports 📉
🔘 Range-bound movement between support & resistance 🔄
🔘 Strong rebound and breakout above resistance 🚀
👇 Share your view in the comments
免责声明
这些信息和出版物并非旨在提供,也不构成TradingView提供或认可的任何形式的财务、投资、交易或其他类型的建议或推荐。请阅读使用条款了解更多信息。
免责声明
这些信息和出版物并非旨在提供,也不构成TradingView提供或认可的任何形式的财务、投资、交易或其他类型的建议或推荐。请阅读使用条款了解更多信息。