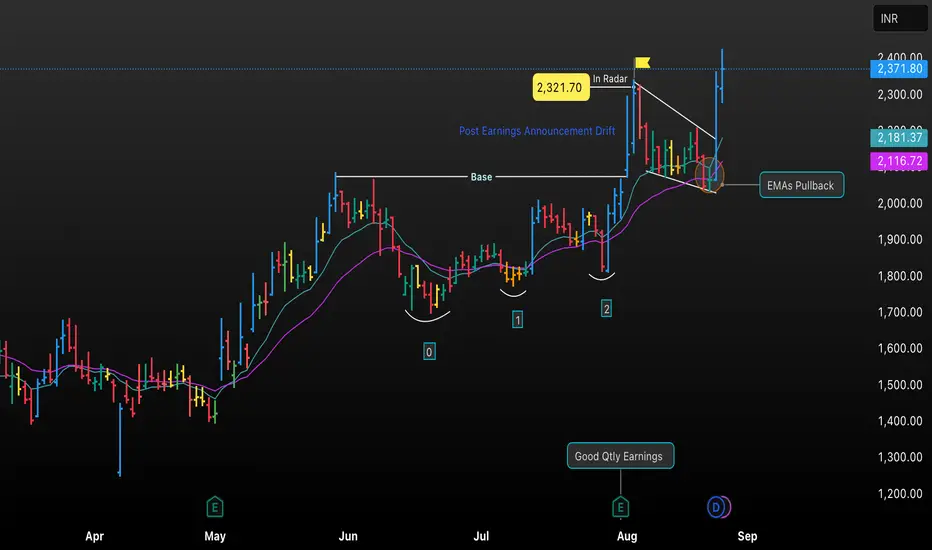
• This chart analyzes NETWEB’s price movement after a favorable quarterly earnings announcement, highlighting post-earnings drift, the formation of a trend base, and recent EMA pullback.
• Key annotations include buy signals, reaction levels, and actionable price zones to help identify optimal entry and exit opportunities for swing and positional trades.
• Clearly marked support and resistance, along with EMA overlays, provide a transparent ‘radar’ for traders to visualize how earnings and technical patterns interact.
免责声明
这些信息和出版物并不意味着也不构成TradingView提供或认可的金融、投资、交易或其它类型的建议或背书。请在使用条款阅读更多信息。
免责声明
这些信息和出版物并不意味着也不构成TradingView提供或认可的金融、投资、交易或其它类型的建议或背书。请在使用条款阅读更多信息。