Technical -
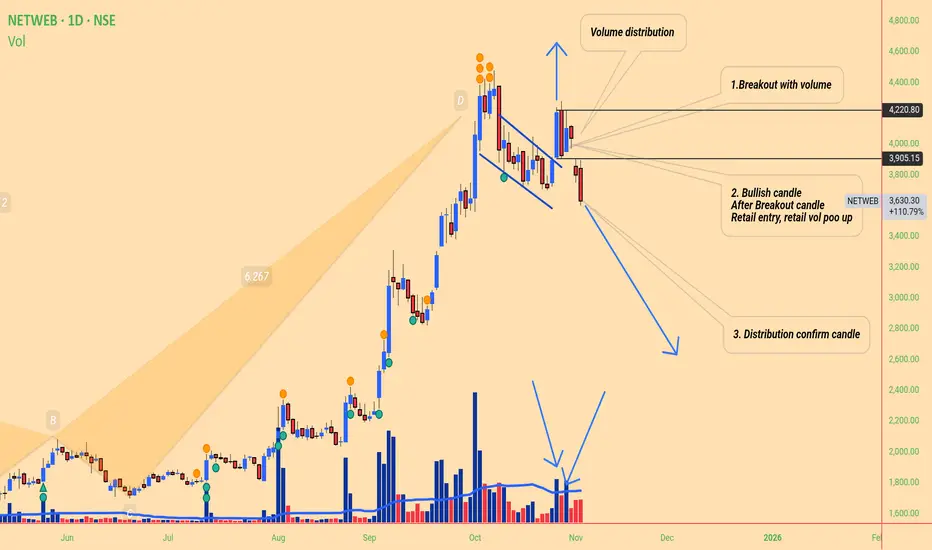
Clear distribution chart , retail heavily trap show on volume, now that area work as
Trap resistance,
3 step distribution happened
1st, break out base ( Trending stock on social media ai hot sector)
2nd break out time volume that attracts retails
3nd after institute sell to retail , clear sign ( small candle show high buyer sellers active)
& Last distribution confirm low volume big red candle ( no one like to purchase that why vol big body candle confirm distribution sign)
Also harmonic pattern type 2 crab( historical pattern)
Fundamentals -
Stock trading 8 time peg ratio , 1 pEG ratio is consider fair but here it 8X
Also compared to us stock like nvidia, this stock overpriced
Also result declared that show poor
Maybe this thing tell stock created top here.......
How volume distribution looklike:
Chaitanya M.
免责声明
这些信息和出版物并非旨在提供,也不构成TradingView提供或认可的任何形式的财务、投资、交易或其他类型的建议或推荐。请阅读使用条款了解更多信息。