📌 NIFTY Trading Plan – 03-Apr-2025
📊 Market Overview:
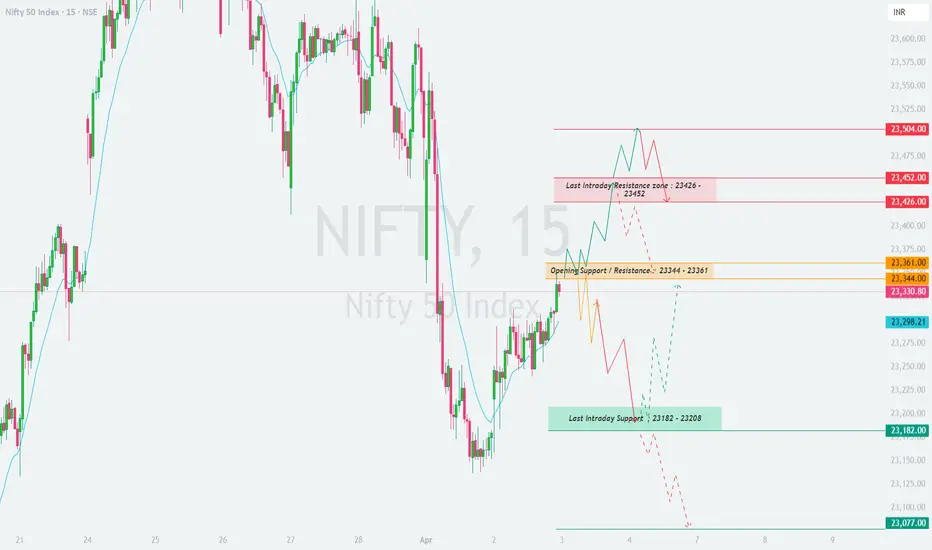
NIFTY closed at 23,330.80, showing signs of recovery from the last intraday support level at 23,182. The opening support/resistance zone (23,344 – 23,361) will be the critical level to watch. The broader trend will be determined by price action near 23,426 – 23,452 resistance and 23,182 – 23,077 support zones.
To trade effectively, let's analyze all possible opening scenarios and structure a trading plan accordingly.
🔼 Scenario 1: Gap-Up Opening (100+ points above 23,426)
A gap-up above 23,426 signals bullish momentum, but the resistance zone at 23,452 – 23,504 will determine whether buyers can sustain higher levels.
✅ Plan of Action:
🎯 Pro Tip: If the gap-up fails to hold 23,426 within the first 15 minutes, it indicates weak buying strength, increasing the probability of a pullback.
⚖ Scenario 2: Flat Opening (Within ±100 points, around 23,330)
A flat opening suggests indecision, where price action near the opening support/resistance zone (23,344 – 23,361) will determine the direction.
✅ Plan of Action:
🎯 Pro Tip: Patience is key in a flat opening. Wait for a strong 15-minute candle closing outside the range before entering a trade.
🔽 Scenario 3: Gap-Down Opening (100+ points below 23,182)
A gap-down below 23,182 indicates bearish sentiment, with buyers likely to step in near the major support zone (23,077 – 23,000).
✅ Plan of Action:
🎯 Pro Tip: If the gap-down happens near a strong support zone, wait for bullish confirmation (e.g., reversal candlestick patterns) before going long.
⚠️ Risk Management Tips for Options Traders
🛑 Avoid Over-leveraging – Maintain proper position sizing to control risk.
⌛ Theta Decay Awareness – Sideways movement will erode option premiums; avoid buying options in a choppy market.
🔄 Use Spreads for Risk Control – Instead of naked options, use spreads to hedge and improve probabilities.
📊 Trade at Key Levels – Avoid random trades; focus on well-defined support and resistance zones.
📌 Summary & Conclusion
📍 Key Levels to Watch:
🟥 Resistance: 23,426 → 23,452 → 23,504 → 23,575
🟧 Opening Support/Resistance Zone: 23,344 – 23,361
🟩 Support: 23,298 → 23,182 → 23,077 → 23,000
🔸 Bullish Bias: Above 23,426, targeting 23,452 – 23,575
🔸 Bearish Bias: Below 23,182, expecting a drop towards 23,077 – 23,000
🔸 Neutral/Choppy: Inside 23,344 – 23,361, avoid unnecessary trades
🎯 Final Advice:
Stick to the structured trading plan and execute only at key levels.
Avoid emotional trading—wait for confirmation before entering trades.
The first 15-30 minutes after market open will provide better clarity—observe price action before committing to a trade.
📢 Disclaimer
I am not a SEBI-registered analyst. This trading plan is for educational purposes only. Please conduct your own research or consult a financial advisor before making any trades.
🚀 Stay updated with live trade setups!
📊 Market Overview:
NIFTY closed at 23,330.80, showing signs of recovery from the last intraday support level at 23,182. The opening support/resistance zone (23,344 – 23,361) will be the critical level to watch. The broader trend will be determined by price action near 23,426 – 23,452 resistance and 23,182 – 23,077 support zones.
To trade effectively, let's analyze all possible opening scenarios and structure a trading plan accordingly.
🔼 Scenario 1: Gap-Up Opening (100+ points above 23,426)
A gap-up above 23,426 signals bullish momentum, but the resistance zone at 23,452 – 23,504 will determine whether buyers can sustain higher levels.
✅ Plan of Action:
- [] If NIFTY holds above 23,426, it may attempt to break 23,452 and head toward 23,504. A sustained move above 23,504 can push the index towards 23,575.
[] If price struggles near 23,452 – 23,504, expect profit booking and a potential retracement towards 23,361 → 23,344. A breakdown below 23,344 could trigger further selling towards 23,298. - Avoid aggressive longs at resistance (23,452 – 23,504) unless a strong breakout with volume occurs. Instead, look for either a retest entry or a breakout confirmation.
🎯 Pro Tip: If the gap-up fails to hold 23,426 within the first 15 minutes, it indicates weak buying strength, increasing the probability of a pullback.
⚖ Scenario 2: Flat Opening (Within ±100 points, around 23,330)
A flat opening suggests indecision, where price action near the opening support/resistance zone (23,344 – 23,361) will determine the direction.
✅ Plan of Action:
- [] Upside case: If NIFTY sustains above 23,361, expect a move towards 23,426 → 23,452. A breakout above 23,452 could push it towards 23,504.
[] Downside case: If NIFTY falls below 23,344, expect a decline towards 23,298 → 23,182. A breakdown below 23,182 will confirm bearish momentum. - No Trade Zone (23,344 – 23,361): Avoid trading within this range unless a clear direction is established.
🎯 Pro Tip: Patience is key in a flat opening. Wait for a strong 15-minute candle closing outside the range before entering a trade.
🔽 Scenario 3: Gap-Down Opening (100+ points below 23,182)
A gap-down below 23,182 indicates bearish sentiment, with buyers likely to step in near the major support zone (23,077 – 23,000).
✅ Plan of Action:
- [] If NIFTY sustains below 23,182, expect a drop towards 23,077 → 23,000. A breakdown below 23,000 could accelerate selling towards 22,907.
[] If NIFTY finds support at 23,077 and rebounds, look for a potential recovery towards 23,182 → 23,298. A strong breakout above 23,298 would signal a bullish reversal. - Be cautious of bear traps – If the market gaps down but quickly recovers, short-covering rallies can trigger a sharp upside move.
🎯 Pro Tip: If the gap-down happens near a strong support zone, wait for bullish confirmation (e.g., reversal candlestick patterns) before going long.
⚠️ Risk Management Tips for Options Traders
🛑 Avoid Over-leveraging – Maintain proper position sizing to control risk.
⌛ Theta Decay Awareness – Sideways movement will erode option premiums; avoid buying options in a choppy market.
🔄 Use Spreads for Risk Control – Instead of naked options, use spreads to hedge and improve probabilities.
📊 Trade at Key Levels – Avoid random trades; focus on well-defined support and resistance zones.
📌 Summary & Conclusion
📍 Key Levels to Watch:
🟥 Resistance: 23,426 → 23,452 → 23,504 → 23,575
🟧 Opening Support/Resistance Zone: 23,344 – 23,361
🟩 Support: 23,298 → 23,182 → 23,077 → 23,000
🔸 Bullish Bias: Above 23,426, targeting 23,452 – 23,575
🔸 Bearish Bias: Below 23,182, expecting a drop towards 23,077 – 23,000
🔸 Neutral/Choppy: Inside 23,344 – 23,361, avoid unnecessary trades
🎯 Final Advice:
Stick to the structured trading plan and execute only at key levels.
Avoid emotional trading—wait for confirmation before entering trades.
The first 15-30 minutes after market open will provide better clarity—observe price action before committing to a trade.
📢 Disclaimer
I am not a SEBI-registered analyst. This trading plan is for educational purposes only. Please conduct your own research or consult a financial advisor before making any trades.
🚀 Stay updated with live trade setups!
免责声明
这些信息和出版物并不意味着也不构成TradingView提供或认可的金融、投资、交易或其它类型的建议或背书。请在使用条款阅读更多信息。
免责声明
这些信息和出版物并不意味着也不构成TradingView提供或认可的金融、投资、交易或其它类型的建议或背书。请在使用条款阅读更多信息。