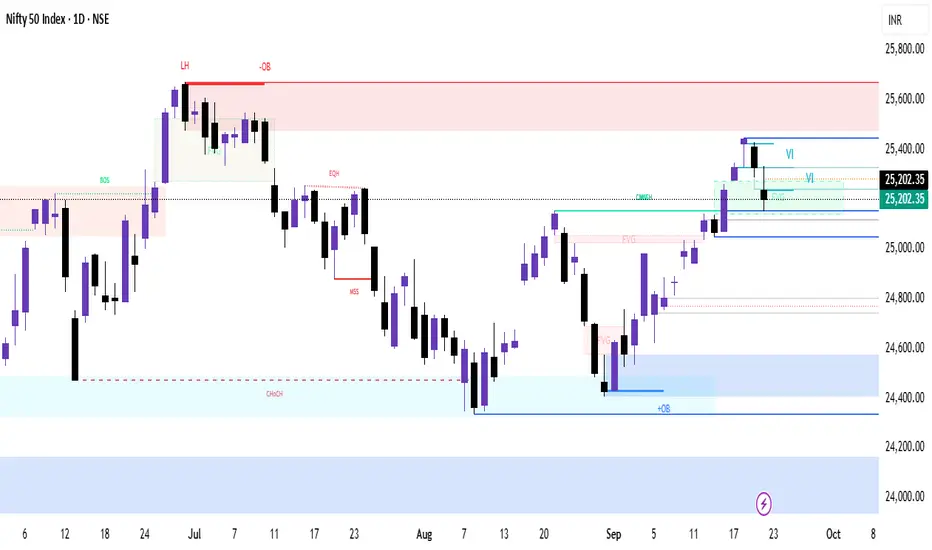
🕒 1-Day Chart
Support Levels:
25,200: Immediate support; bulls need to defend this level.
25,050: Critical support; a break below this could lead to further downside.
Resistance Levels:
25,300: Immediate resistance; a breakout above this could lead to a rally.
25,450–25,500: Key resistance zone; bulls need to reclaim this for a bullish trend.
Technical Indicators:
RSI is below 60, indicating weakening momentum.
MACD shows a bearish crossover, suggesting potential downside.
Market Sentiment:
The index formed a bearish candle with a long upper shadow, indicating selling pressure at higher levels.
The index is trading below the 10-day EMA, suggesting a short-term downtrend.
🕓 4-Hour Chart
Support Levels:
25,150: Immediate support; a break below this could lead to further downside.
25,000: Strong support; bulls need to defend this level.
Resistance Levels:
25,300: Immediate resistance; a breakout above this could lead to a rally.
25,450: Key resistance; bulls need to reclaim this for a bullish trend.
Technical Indicators:
RSI is below 60, indicating weakening momentum.
MACD shows a bearish crossover, suggesting potential downside.
Market Sentiment:
The index is trading below the 10-period EMA, suggesting a short-term downtrend.
🕐 1-Hour Chart
Support Levels:
25,150: Immediate support; a break below this could lead to further downside.
25,000: Strong support; bulls need to defend this level.
Resistance Levels:
25,250: Immediate resistance; a breakout above this could lead to a rally.
25,400: Key resistance; bulls need to reclaim this for a bullish trend.
Technical Indicators:
RSI is below 60, indicating weakening momentum.
MACD shows a bearish crossover, suggesting potential downside.
Market Sentiment:
The index is trading below the 10-period EMA, suggesting a short-term downtrend.
🕒 15-Minute Chart
Support Levels:
25,150: Immediate support; a break below this could lead to further downside.
25,000: Strong support; bulls need to defend this level.
Resistance Levels:
25,250: Immediate resistance; a breakout above this could lead to a rally.
25,400: Key resistance; bulls need to reclaim this for a bullish trend.
Technical Indicators:
RSI is below 60, indicating weakening momentum.
MACD shows a bearish crossover, suggesting potential downside.
Market Sentiment:
The index is trading below the 10-period EMA, suggesting a short-term downtrend.
Support Levels:
25,200: Immediate support; bulls need to defend this level.
25,050: Critical support; a break below this could lead to further downside.
Resistance Levels:
25,300: Immediate resistance; a breakout above this could lead to a rally.
25,450–25,500: Key resistance zone; bulls need to reclaim this for a bullish trend.
Technical Indicators:
RSI is below 60, indicating weakening momentum.
MACD shows a bearish crossover, suggesting potential downside.
Market Sentiment:
The index formed a bearish candle with a long upper shadow, indicating selling pressure at higher levels.
The index is trading below the 10-day EMA, suggesting a short-term downtrend.
🕓 4-Hour Chart
Support Levels:
25,150: Immediate support; a break below this could lead to further downside.
25,000: Strong support; bulls need to defend this level.
Resistance Levels:
25,300: Immediate resistance; a breakout above this could lead to a rally.
25,450: Key resistance; bulls need to reclaim this for a bullish trend.
Technical Indicators:
RSI is below 60, indicating weakening momentum.
MACD shows a bearish crossover, suggesting potential downside.
Market Sentiment:
The index is trading below the 10-period EMA, suggesting a short-term downtrend.
🕐 1-Hour Chart
Support Levels:
25,150: Immediate support; a break below this could lead to further downside.
25,000: Strong support; bulls need to defend this level.
Resistance Levels:
25,250: Immediate resistance; a breakout above this could lead to a rally.
25,400: Key resistance; bulls need to reclaim this for a bullish trend.
Technical Indicators:
RSI is below 60, indicating weakening momentum.
MACD shows a bearish crossover, suggesting potential downside.
Market Sentiment:
The index is trading below the 10-period EMA, suggesting a short-term downtrend.
🕒 15-Minute Chart
Support Levels:
25,150: Immediate support; a break below this could lead to further downside.
25,000: Strong support; bulls need to defend this level.
Resistance Levels:
25,250: Immediate resistance; a breakout above this could lead to a rally.
25,400: Key resistance; bulls need to reclaim this for a bullish trend.
Technical Indicators:
RSI is below 60, indicating weakening momentum.
MACD shows a bearish crossover, suggesting potential downside.
Market Sentiment:
The index is trading below the 10-period EMA, suggesting a short-term downtrend.
免责声明
这些信息和出版物并不意味着也不构成TradingView提供或认可的金融、投资、交易或其它类型的建议或背书。请在使用条款阅读更多信息。