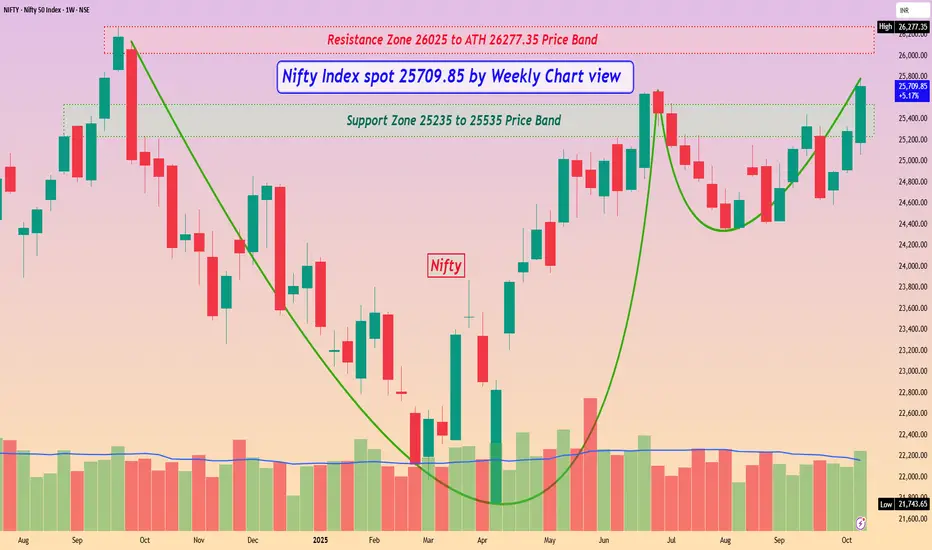
Nifty Index spot 25709.85 by Weekly Chart view
- Support Zone 25235 to 25535 Price Band
- Resistance Zone 26025 to ATH 26277.35 Price Band
- Crystal Clear Bullish Cup & Handle formed around Support Zone
- Lets hope for the best to happen based on this Nifty 50 Index Chart setup
- Sharing this beautiful Nifty Index Chart setup, courtesy by a curious Co-Learners observation 😊👍🏽🤞🏽
相关出版物
免责声明
这些信息和出版物并不意味着也不构成TradingView提供或认可的金融、投资、交易或其它类型的建议或背书。请在使用条款阅读更多信息。