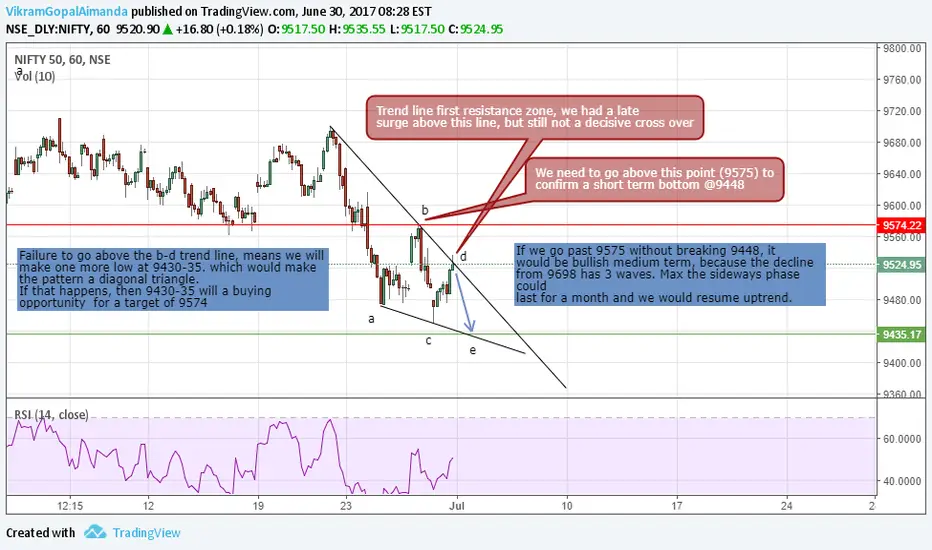
2 possibilities from here.
a) we could be forming a diagonal triangle, with abcd waves completed and wave e pending with a target of 9430-35. This count remains valid till we dont go above 9575.
b) if we go past 9575 , then it would mean that 9448 (today's low ) was atleast a short term bottom. we could either be making a sideways time consuming b wave or a new wave up is materializing.
How to trade?
If already short , then 9575 should be stop loss, target 9430-35
If already long, then 9400 should be stop loss.
If planning to trade, then a dip to 9430-35 offer a buying opportunity for a target of 9575, else if we go above b-d line, then next corrective dip should be bought ( entry and stop loss can arrive once wave pattern evolves)
Market is complex, the above analysis we write based on recent data. The view keeps changing as we progress.
If you need timely advice , follow my post.
免责声明
这些信息和出版物并不意味着也不构成TradingView提供或认可的金融、投资、交易或其它类型的建议或背书。请在使用条款阅读更多信息。
免责声明
这些信息和出版物并不意味着也不构成TradingView提供或认可的金融、投资、交易或其它类型的建议或背书。请在使用条款阅读更多信息。