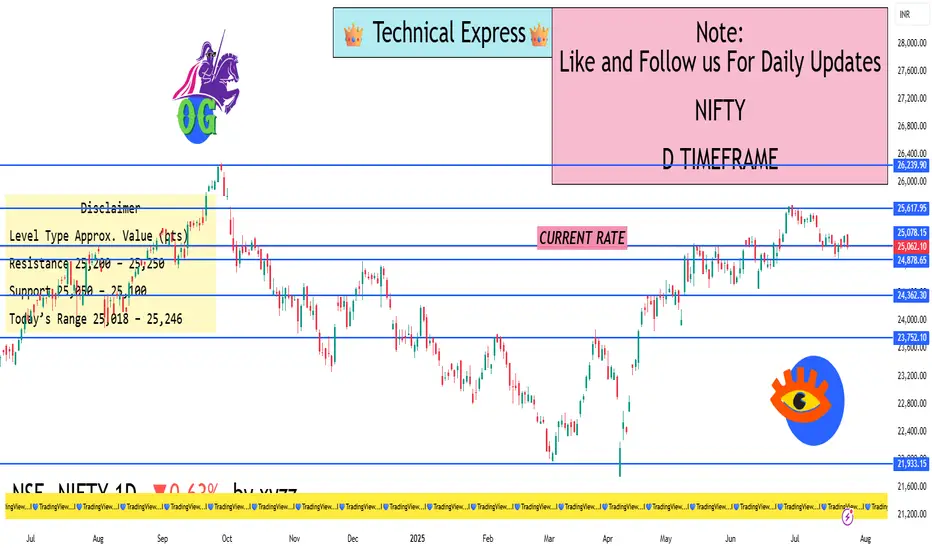
📌 Current Data (as of early afternoon):
Current Price: Around 25,060
Opening Price: Approx. 25,200
Day’s High: ~25,246
Day’s Low: ~25,018
Previous Close: 25,216
Net Change: Down by ~155 points (–0.62%)
🔍 Intraday Price Action Analysis
Opening Weakness: Nifty opened lower than yesterday’s close due to weak global cues and selling in major sectors.
Bearish Pressure: Sellers dominated early in the day, dragging the index below 25,100.
Support Level Tested: Nifty hovered near 25,050, which acted as a short-term support.
Limited Bounce: Despite attempts to recover, resistance near 25,200–25,250 is capping upside movement.
📊 Technical Summary – 1D Timeframe
Type Range / Value
Support Levels 25,050 / 25,000
Resistance Levels 25,200 / 25,250
Trend Bias Slightly Bearish
Momentum Weak, with mild recovery attempts
Volatility Moderate
If Nifty holds above 25,050, it could try to reclaim 25,200–25,250.
A break below 25,018–25,000 may trigger further downside toward 24,950.
🧠 Why Nifty Is Down Today
IT Sector Weakness: Poor performance in tech stocks after recent earnings reports is dragging the index.
Banking Stocks Pressure: Major private and PSU banks are showing weakness due to profit booking.
Profit Booking: Traders are cashing out after last week's rally near all-time highs.
Global Market Impact: Uncertainty in international markets and trade concerns are weighing on sentiment.
🎯 What Traders Should Watch Next
Key Intraday Level: 25,050 — If Nifty stays above this level, short-term stability is possible.
Breakout Point: 25,250 — A close above this may indicate fresh bullish momentum.
Breakdown Point: Below 25,000 — Could lead to deeper correction toward 24,950–24,900.
Volatility Spike?: Stay alert around closing hours—FII/DII data and global market opening will affect the closing trend.
✅ Conclusion
Nifty 50 is under pressure today due to sectoral weakness and lack of strong domestic triggers. The index is currently range-bound between 25,000–25,250. Traders should monitor these levels closely for the next directional move.
I built a Buy & Sell Signal Indicator with 85% accuracy.
📈 Get access via DM or
WhatsApp: wa.link/d997q0
Contact - +91 76782 40962
| Email: techncialexpress@gmail.com
| Script Coder | Trader | Investor | From India
📈 Get access via DM or
WhatsApp: wa.link/d997q0
Contact - +91 76782 40962
| Email: techncialexpress@gmail.com
| Script Coder | Trader | Investor | From India
相关出版物
免责声明
这些信息和出版物并非旨在提供,也不构成TradingView提供或认可的任何形式的财务、投资、交易或其他类型的建议或推荐。请阅读使用条款了解更多信息。