NIFTY TRADING PLAN – 05-Sep-2025
📌 Key Levels to Watch:
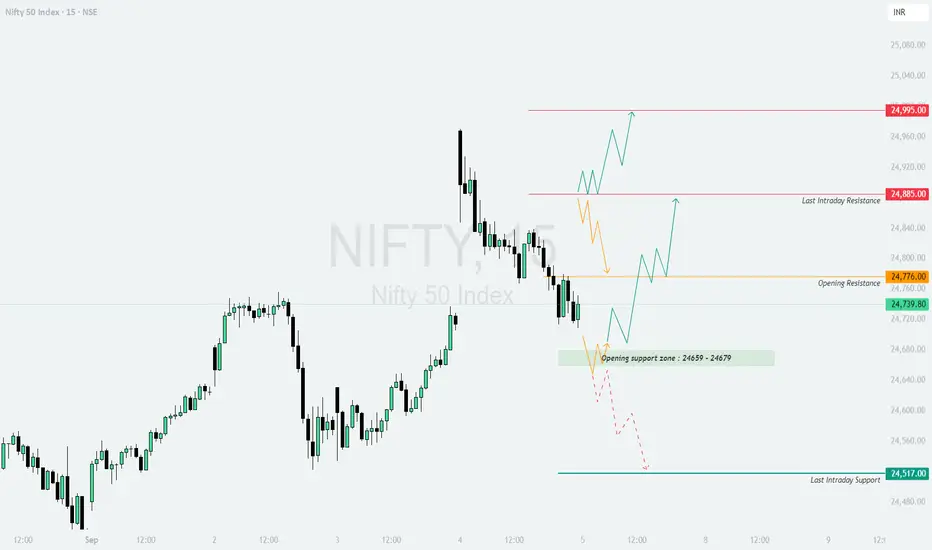
Opening Resistance: 24,776
Last Intraday Resistance: 24,885
Major Resistance: 24,995
Opening Support Zone: 24,659 – 24,679
Last Intraday Support: 24,517
The price action shows that Nifty is consolidating between strong support and resistance zones. The reaction around these levels will determine the day’s trend.
🔼 1. Gap-Up Opening (100+ points above 24,840)
If Nifty opens with a strong gap-up above 24,840, it will directly challenge the resistance zones.
📌 Plan of Action:
👉 Educational Note: Gap-ups near resistance require patience. Wait for confirmation candles before entering, as false breakouts are common at these levels.
➖ 2. Flat Opening (Around 24,720 – 24,780)
A flat start near the opening resistance indicates indecision and may lead to range-bound action initially.
📌 Plan of Action:
👉 Educational Note: Flat openings often provide the best opportunities as they allow traders to position based on the first 30 minutes of price action clarity.
🔽 3. Gap-Down Opening (100+ points below 24,620)
If Nifty opens below the support zone, sellers gain the upper hand.
📌 Plan of Action:
👉 Educational Note: Gap-downs usually trigger fear-driven moves. Avoid chasing the fall; instead, look for a retest of levels to confirm direction.
🛡️ Risk Management Tips for Options Traders
📌 Summary & Conclusion
🟢 Above 24,885 → Bullish bias towards 24,995 and beyond.
🟧 Flat Opening (24,720 – 24,780) → Wait for a breakout above 24,776 for directional clarity.
🔴 Below 24,620 → Weakness towards 24,517 with risk of further downside.
⚠️ Critical Zone: 24,659 – 24,679 (Opening Support). Watch this level closely for intraday cues.
⚠️ Disclaimer: I am not a SEBI-registered analyst. This analysis is purely educational and should not be considered financial advice. Please consult your financial advisor before making any trading decisions.
📌 Key Levels to Watch:
Opening Resistance: 24,776
Last Intraday Resistance: 24,885
Major Resistance: 24,995
Opening Support Zone: 24,659 – 24,679
Last Intraday Support: 24,517
The price action shows that Nifty is consolidating between strong support and resistance zones. The reaction around these levels will determine the day’s trend.
🔼 1. Gap-Up Opening (100+ points above 24,840)
If Nifty opens with a strong gap-up above 24,840, it will directly challenge the resistance zones.
📌 Plan of Action:
- [] Sustaining above 24,885 (last intraday resistance) will indicate strength.
[] First upside target is 24,995, where profit booking could emerge. - If momentum sustains beyond 24,995, expect a breakout rally with strong bullish sentiment.
👉 Educational Note: Gap-ups near resistance require patience. Wait for confirmation candles before entering, as false breakouts are common at these levels.
➖ 2. Flat Opening (Around 24,720 – 24,780)
A flat start near the opening resistance indicates indecision and may lead to range-bound action initially.
📌 Plan of Action:
- [] If Nifty sustains above 24,776, it can attempt to test 24,885.
[] A breakout above 24,885 strengthens the bullish trend towards 24,995. - Failure to hold above 24,720 can pull the index back into the support zone (24,659–24,679).
👉 Educational Note: Flat openings often provide the best opportunities as they allow traders to position based on the first 30 minutes of price action clarity.
🔽 3. Gap-Down Opening (100+ points below 24,620)
If Nifty opens below the support zone, sellers gain the upper hand.
📌 Plan of Action:
- [] A gap-down below 24,620 will likely drag Nifty to retest 24,517 (last intraday support).
[] Sustaining below 24,517 may invite further downside pressure with intraday weakness. - Quick rebounds can occur, but unless Nifty reclaims 24,659, the trend remains bearish.
👉 Educational Note: Gap-downs usually trigger fear-driven moves. Avoid chasing the fall; instead, look for a retest of levels to confirm direction.
🛡️ Risk Management Tips for Options Traders
- [] Always use stop losses on an hourly close basis to avoid false moves.
[] Limit exposure to 1–2% of capital per trade.
[] For uncertain days, consider deploying neutral strategies like straddles or strangles.
[] Scale out profits gradually instead of waiting for final targets. - Avoid over-leveraging; keep cash ready for adjustments.
📌 Summary & Conclusion
🟢 Above 24,885 → Bullish bias towards 24,995 and beyond.
🟧 Flat Opening (24,720 – 24,780) → Wait for a breakout above 24,776 for directional clarity.
🔴 Below 24,620 → Weakness towards 24,517 with risk of further downside.
⚠️ Critical Zone: 24,659 – 24,679 (Opening Support). Watch this level closely for intraday cues.
⚠️ Disclaimer: I am not a SEBI-registered analyst. This analysis is purely educational and should not be considered financial advice. Please consult your financial advisor before making any trading decisions.
免责声明
这些信息和出版物并非旨在提供,也不构成TradingView提供或认可的任何形式的财务、投资、交易或其他类型的建议或推荐。请阅读使用条款了解更多信息。
免责声明
这些信息和出版物并非旨在提供,也不构成TradingView提供或认可的任何形式的财务、投资、交易或其他类型的建议或推荐。请阅读使用条款了解更多信息。