~~ Technical Analysis ~~
Short-Term (Daily/Weekly):
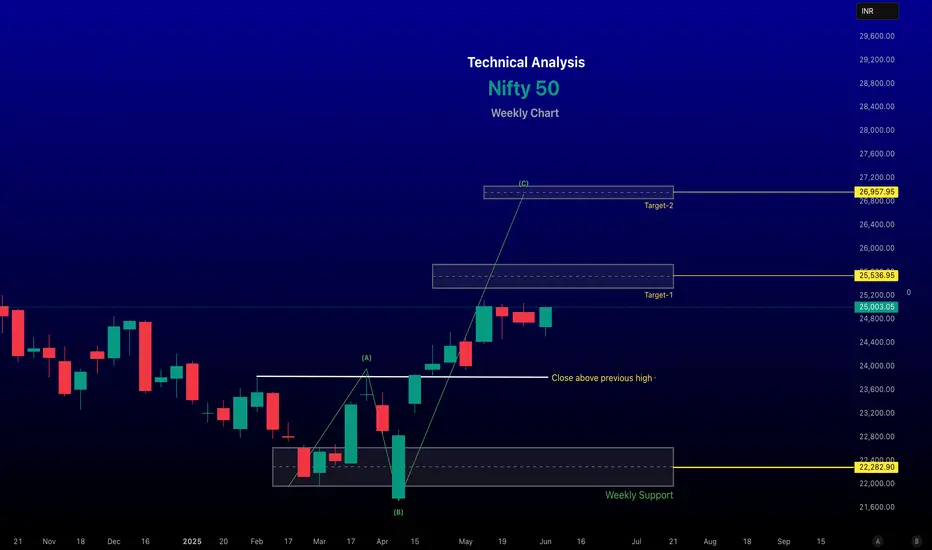
The Nifty 50 is currently trading within an ascending channel on the daily/weekly chart, indicating a bullish structure. However, it faces resistance in the 25,050–25,070 range. A breakout above this could target 25,300–25,600, while a drop below 24,700 may signal short-term weakness.
Recent suggest the index is testing key support levels, with the 200-day Exponential Moving Average (EMA) and a major trend line around 23,300–23,600 acting as critical support. A break below this could indicate a bearish shift.
The Relative Strength Index (RSI) on the daily chart has previously hit oversold levels (below 30) in March 2025, suggesting potential for a bounce if similar conditions reoccur.
-- Disclaimer --
This analysis is based on recent technical data and market sentiment from web sources. It is for informational and educational purposes only and not financial advice. Trading involves high risks, and past performance does not guarantee future results. Always conduct your own research or consult a SEBI-registered advisor before trading.
#Boost and comment will be highly appreciated
Short-Term (Daily/Weekly):
The Nifty 50 is currently trading within an ascending channel on the daily/weekly chart, indicating a bullish structure. However, it faces resistance in the 25,050–25,070 range. A breakout above this could target 25,300–25,600, while a drop below 24,700 may signal short-term weakness.
Recent suggest the index is testing key support levels, with the 200-day Exponential Moving Average (EMA) and a major trend line around 23,300–23,600 acting as critical support. A break below this could indicate a bearish shift.
The Relative Strength Index (RSI) on the daily chart has previously hit oversold levels (below 30) in March 2025, suggesting potential for a bounce if similar conditions reoccur.
-- Disclaimer --
This analysis is based on recent technical data and market sentiment from web sources. It is for informational and educational purposes only and not financial advice. Trading involves high risks, and past performance does not guarantee future results. Always conduct your own research or consult a SEBI-registered advisor before trading.
#Boost and comment will be highly appreciated
renderwithme
相关出版物
免责声明
这些信息和出版物并不意味着也不构成TradingView提供或认可的金融、投资、交易或其它类型的建议或背书。请在使用条款阅读更多信息。