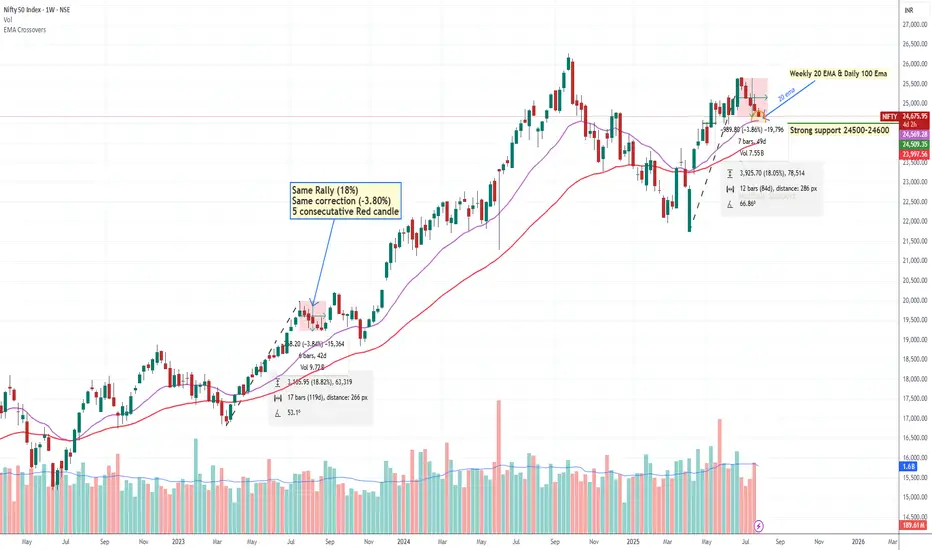
We Are Expecting A bounce back from 24500-24600 level Why? let's Try to understand
(1) Nifty daily Chart 100 EMA
(2) Weekly Chart 200 EMA
(3) there is Multiple support testing around 24500 showing intuitional pending Order.
(4) Nifty bottom out with up move around 18 % & now We are seeing 5 Consecutive Falling
Weekly Candle same pattern happened in July 2023 when nifty Rallied around 18 % and there
was also correction around -3.80%.
(5) A 5-candle rule may apply (Means high possibility of bounce back or pullback if we got 5 consecutive candles either upside or downside)
This is pure technical analysis just based on market behaviour, pattern or historical data. not included any fundamental factor.
免责声明
这些信息和出版物并不意味着也不构成TradingView提供或认可的金融、投资、交易或其它类型的建议或背书。请在使用条款阅读更多信息。