VWAP Zone:
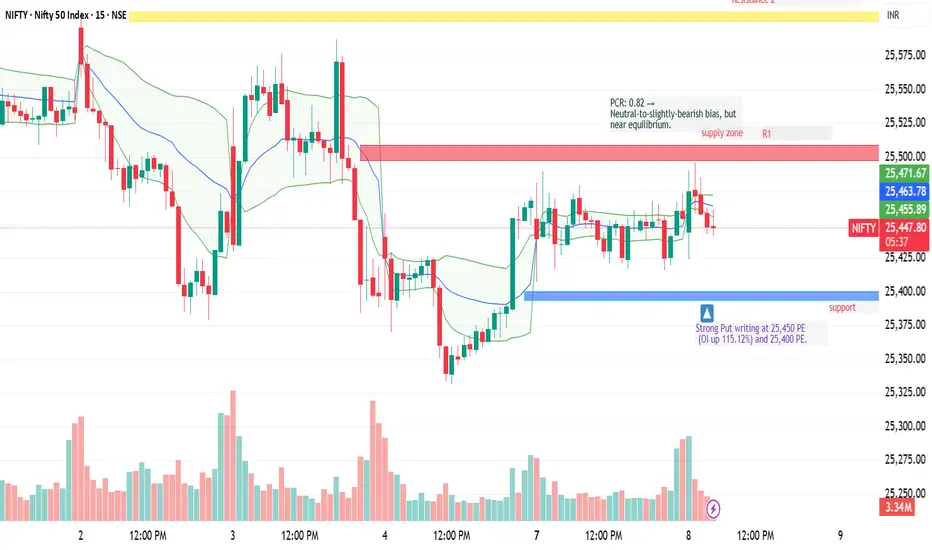
The VWAP lies at 25,456–25,464, acting as a dynamic resistance zone — price has failed to sustain above this level multiple times.
Price Pattern:
Multiple small-bodied candles with wicks indicate indecision and low momentum.
This suggests volatility compression — a breakout may follow.
Bollinger Bands:
Price hugging the middle band, with slightly narrowing bands — signals range contraction.
免责声明
这些信息和出版物并不意味着也不构成TradingView提供或认可的金融、投资、交易或其它类型的建议或背书。请在使用条款阅读更多信息。