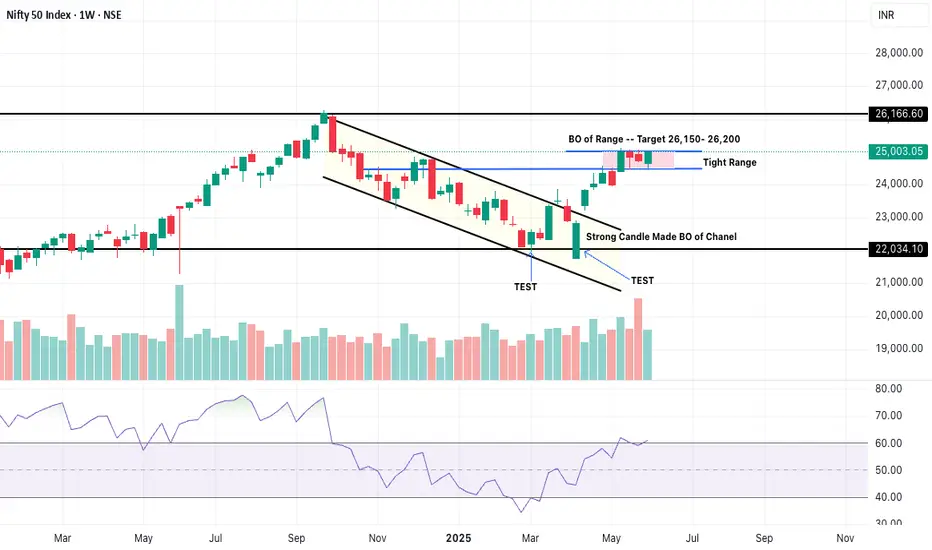
The Nifty 50 chart exhibits strong bullish momentum. The breakout from the downward channel, followed by consolidation in a tight range and then a breakout from that range, all point towards continued upward movement. The immediate target for this move is identified between 26,150 and 26,200, which is very close to a major resistance level at 26,166.60.
Potential Scenarios:
Continued Bullish Momentum: If the Nifty 50 can decisively break above the 26,166.60 resistance, it could signal further upside.
Resistance at Target: The price might face strong resistance at the 26,150-26,200 range and the 26,166.60 level, potentially leading to a pullback or further consolidation.
Support Levels to Watch: If there's a pullback, the top of the "Tight Range" and then the 25,000 psychological level, followed by the top of the broken channel, would be key support levels to watch.
Disclaimer: This analysis is based solely on the provided image and does not constitute financial advice. Trading involves risk, and past performance is not indicative of future results.
免责声明
这些信息和出版物并不意味着也不构成TradingView提供或认可的金融、投资、交易或其它类型的建议或背书。请在使用条款阅读更多信息。
免责声明
这些信息和出版物并不意味着也不构成TradingView提供或认可的金融、投资、交易或其它类型的建议或背书。请在使用条款阅读更多信息。