搜索
产品
社区
市场
经纪商
更多
CN
开始
Nifty 50指数
8月17日
nifty 50 simple analysis
0
获取这个图表
获取这个图表
83
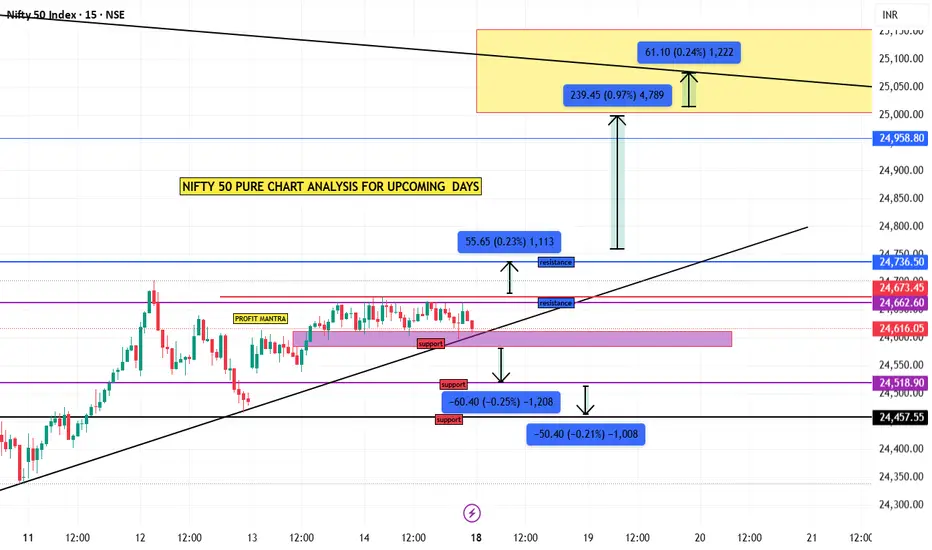
pure price action chart analysis. here nifty 50 behave sideways
in 15 minute time frame, see chart you can understand.
vijay24feb
关注
更多:
chartanalysis
Chart Patterns
Technical Indicators
NIFTY
niftylevels
niftytrend
trading
Trend Analysis
Trend Line Break
相关出版物
hdfc bank chart analysis
由vijay24feb提供
免责声明
这些信息和出版物并不意味着也不构成TradingView提供或认可的金融、投资、交易或其它类型的建议或背书。请在
使用条款
阅读更多信息。
chartanalysis
Chart Patterns
Technical Indicators
NIFTY
niftylevels
niftytrend
trading
Trend Analysis
Trend Line Break
vijay24feb
关注
更多:
相关出版物
hdfc bank chart analysis
由vijay24feb提供
免责声明
这些信息和出版物并不意味着也不构成TradingView提供或认可的金融、投资、交易或其它类型的建议或背书。请在
使用条款
阅读更多信息。