> Previous Month (November) price has formed a Positive Base Candle.
* High- 26310 * Low - 25318 * Open - 25696 * Close - 26202
> On November 2 week price has given a Bullish Upside move after that continuesly 4 Week price has formed Base Candle No Upside or Downside Big Movementum.
> Current price of the market is 25693
> Previous week Low was 25693
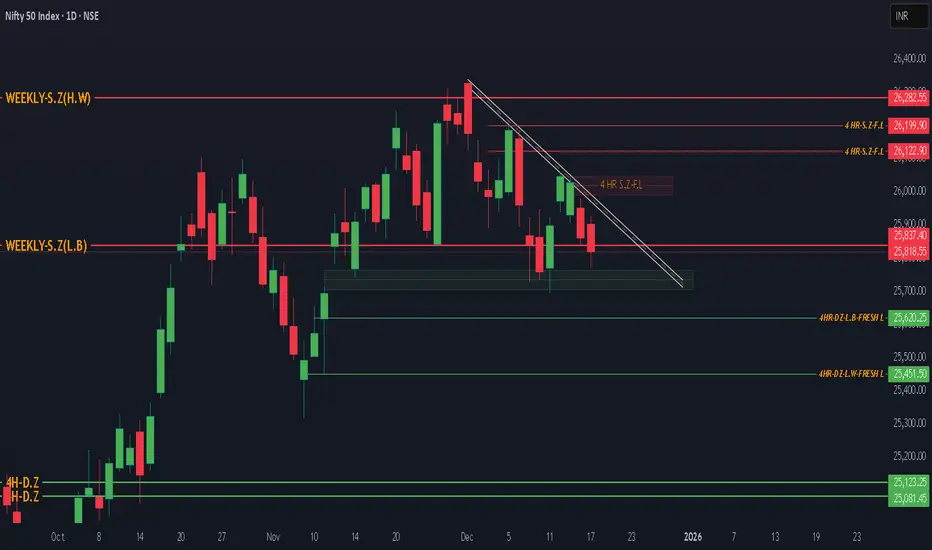
Support Level in Higher Time Frame ( Minor Support Level)
1 . 25696 this level is the support of Monthly Time frame which nis the Open Price of the Previous Month Candle.
2 . 25500 this is the weekly support level.
Major Support Level
1 . 24734 to 24337 is the Major Support Level in Monthly Time Frame.
Reason-: This has 1 Drop candle 2 Base candle and A very Big Rally Candle which is the bullish pattern .
Now price has taken two times support from 25696. Now this level is week and upside two good supply zones are there in 4 hour time frame.
And Downside 25620 to 25451 is the next demand zone in 4 hour time frame which can give support to the price.
RSI Indigator is also showing downside diversion from 29th October 2025.
* High- 26310 * Low - 25318 * Open - 25696 * Close - 26202
> On November 2 week price has given a Bullish Upside move after that continuesly 4 Week price has formed Base Candle No Upside or Downside Big Movementum.
> Current price of the market is 25693
> Previous week Low was 25693
Support Level in Higher Time Frame ( Minor Support Level)
1 . 25696 this level is the support of Monthly Time frame which nis the Open Price of the Previous Month Candle.
2 . 25500 this is the weekly support level.
Major Support Level
1 . 24734 to 24337 is the Major Support Level in Monthly Time Frame.
Reason-: This has 1 Drop candle 2 Base candle and A very Big Rally Candle which is the bullish pattern .
Now price has taken two times support from 25696. Now this level is week and upside two good supply zones are there in 4 hour time frame.
And Downside 25620 to 25451 is the next demand zone in 4 hour time frame which can give support to the price.
RSI Indigator is also showing downside diversion from 29th October 2025.
免责声明
这些信息和出版物并非旨在提供,也不构成TradingView提供或认可的任何形式的财务、投资、交易或其他类型的建议或推荐。请阅读使用条款了解更多信息。
免责声明
这些信息和出版物并非旨在提供,也不构成TradingView提供或认可的任何形式的财务、投资、交易或其他类型的建议或推荐。请阅读使用条款了解更多信息。