📌 NIFTY Weekly Chart – Double Bottom Breakout Analysis
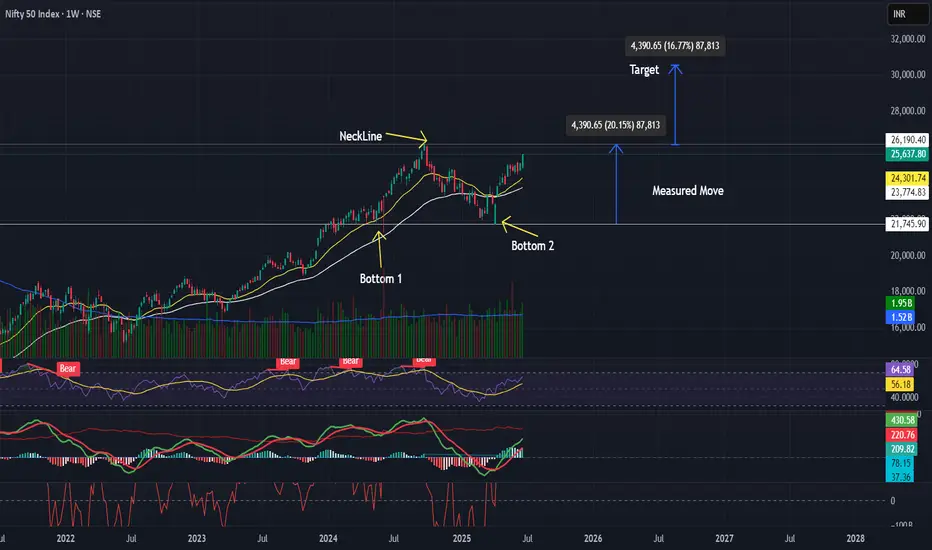
After a long corrective phase, NIFTY is forming a classic Double Bottom pattern on the weekly timeframe. This is typically a bullish reversal signal.
✅ Pattern: Double Bottom on Weekly Chart
✅ Bottom Levels: ~21,800
✅ Neckline Resistance: ~26,200
📈 Breakout Strategy:
Watch for a weekly close above 26,200 with higher volume to confirm breakout strength.
✅ Measured Move Target: ~30,600
Calculation: Neckline + (Neckline – Bottom) ≈ 26,200 + (4,400)
✅ Stop-loss Options:
ATR-based stop: ~25,530
Chart-based conservative stop: ~24,500
🔎 Bias: Bullish above 26,200 with confirmed weekly close and volume expansion.
📌 Volume Note: Look for rising volume near the neckline to validate the breakout.
This setup aligns with strong macro drivers such as India’s economic resilience and sector rotation into large caps.
免责声明
这些信息和出版物并非旨在提供,也不构成TradingView提供或认可的任何形式的财务、投资、交易或其他类型的建议或推荐。请阅读使用条款了解更多信息。