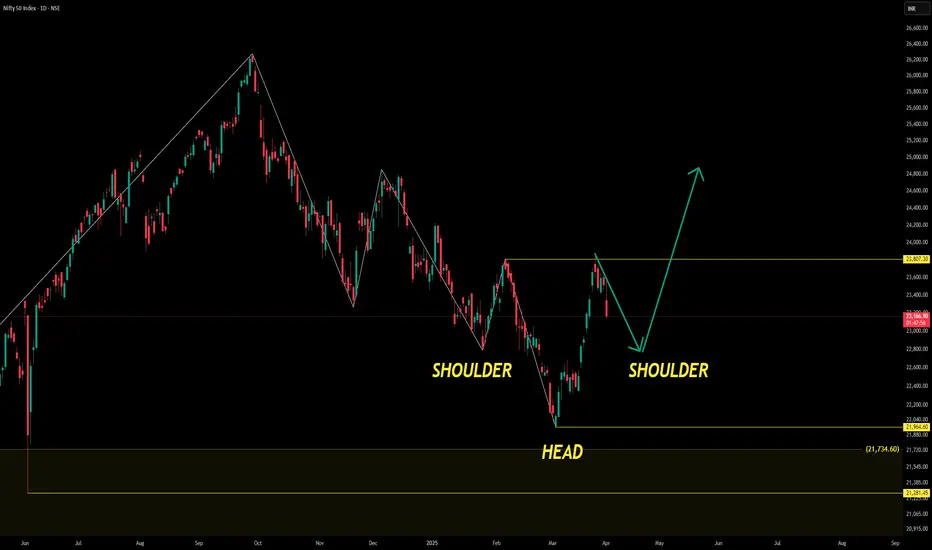
The Head and Shoulders consists of three distinct peaks:
Left Shoulder: A peak observed towards the end of November, followed by a downward movement.
Head: The highest peak formed around early January, indicating a strong upward movement before declining.
Right Shoulder: A smaller peak formed in late March, followed by another decline.
The neckline, which is a horizontal line connecting the troughs between the shoulders and the head, is positioned near 21,734.60 INR. This neckline is a critical support level that traders closely monitor.
Potential Scenarios
Bearish Reversal: If the price breaks below the neckline, it could signal a bearish trend, potentially leading to further price declines. This aligns with classic Head and Shoulders behavior.
Bullish Breakout: There’s also an upward arrow on the chart suggesting a potential bullish breakout above the right shoulder, targeting a level of 23,807.30 INR. This would indicate a rejection of the bearish setup, leading to a trend reversal to the upside.
Additional Observations
The current price is 23,162.10 INR, down by 357.25 points (-1.52%), with a trading volume of 255.38M. This recent decline might indicate pressure near the neckline level, reinforcing its importance in upcoming sessions.
From this analysis, traders might:
Keep an eye on the neckline for signs of a breakdown or reversal.
Watch for volume spikes during any breakout or breakdown, as these could confirm the validity of the movement.
免责声明
这些信息和出版物并不意味着也不构成TradingView提供或认可的金融、投资、交易或其它类型的建议或背书。请在使用条款阅读更多信息。
免责声明
这些信息和出版物并不意味着也不构成TradingView提供或认可的金融、投资、交易或其它类型的建议或背书。请在使用条款阅读更多信息。