Magical numbers - 30,60,90,120,180,240,270, and 360.
Take Nifty chart and go to daily chart.
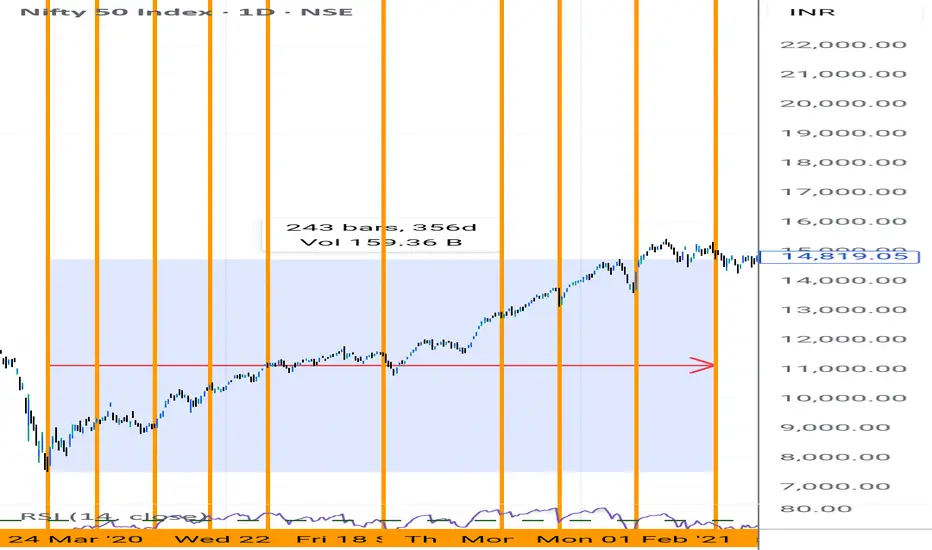
Now check previous major swing high and swing low. In other terms top and bottom.
Now take a date range tool from drawing mode and start counting the days as mentioned above.
You will see the Magic of these numbers. Let me as you where did it came from? Its 3,6,9 rule theory of Gann.
For better confluence, take previous two top and two bottoms. If many verticals lines alligned on the same date something big is going to happen.
Check and Verify by yourself.
Note - Above charts shows I marked only from one bottom till 360 days.What if I added 2 tops and one more bottom? Mathematics is magic!
Take Nifty chart and go to daily chart.
Now check previous major swing high and swing low. In other terms top and bottom.
Now take a date range tool from drawing mode and start counting the days as mentioned above.
You will see the Magic of these numbers. Let me as you where did it came from? Its 3,6,9 rule theory of Gann.
For better confluence, take previous two top and two bottoms. If many verticals lines alligned on the same date something big is going to happen.
Check and Verify by yourself.
Note - Above charts shows I marked only from one bottom till 360 days.What if I added 2 tops and one more bottom? Mathematics is magic!
免责声明
这些信息和出版物并不意味着也不构成TradingView提供或认可的金融、投资、交易或其它类型的建议或背书。请在使用条款阅读更多信息。
免责声明
这些信息和出版物并不意味着也不构成TradingView提供或认可的金融、投资、交易或其它类型的建议或背书。请在使用条款阅读更多信息。