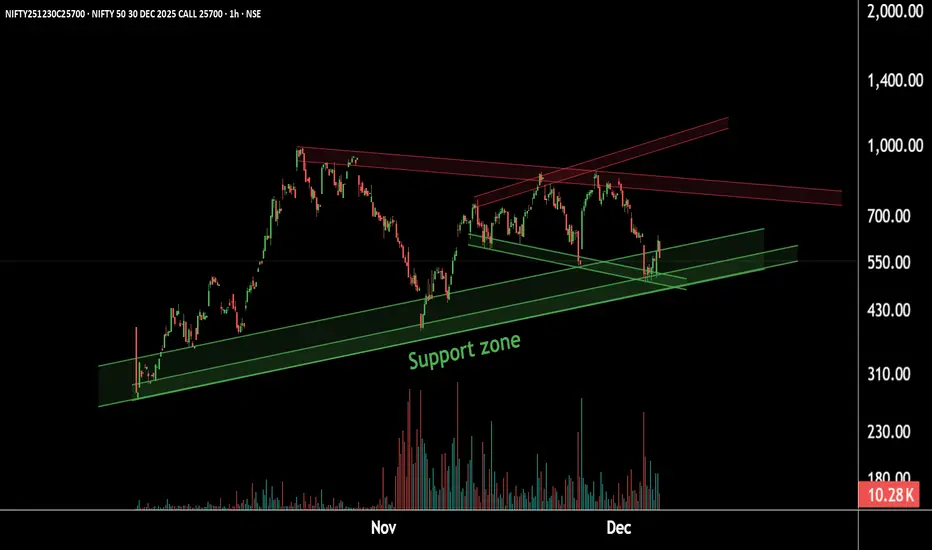
This is the 1-hour timeframe chart of the NIFTY 25,700 CE.
The option is currently trending near a strong support zone at ₹450–₹500.
The chart indicates that the call is taking support at this level, and any dip into this zone may trigger a bullish reversal.
If this support holds, we may witness an upside move toward the potential resistance area of ₹800–₹850 , short term level 680 and 730 .
Thank you.
@RahulSaraoge
Connect us at t.me/stridesadvisory
Connect us at t.me/stridesadvisory
免责声明
这些信息和出版物并非旨在提供,也不构成TradingView提供或认可的任何形式的财务、投资、交易或其他类型的建议或推荐。请阅读使用条款了解更多信息。
@RahulSaraoge
Connect us at t.me/stridesadvisory
Connect us at t.me/stridesadvisory
免责声明
这些信息和出版物并非旨在提供,也不构成TradingView提供或认可的任何形式的财务、投资、交易或其他类型的建议或推荐。请阅读使用条款了解更多信息。