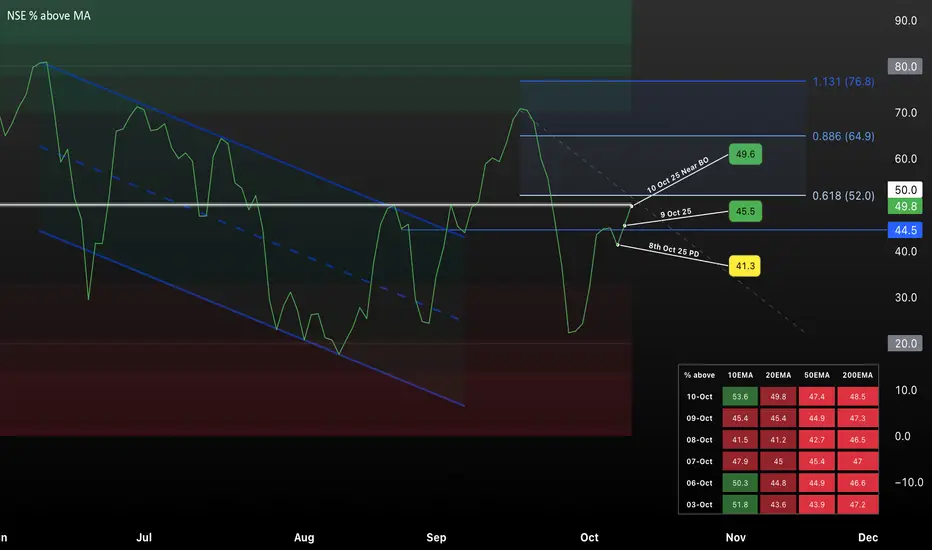
This TradingView chart visualizes the percentage of NSE stocks trading above key moving averages (10EMA, 20EMA, 50EMA, 200EMA) over recent months, highlighting a potential breakout zone as of October 2025. Key price levels (41.3, 44.5, 45.5, 49.6) are marked, with Fibonacci retracement zones indicating possible resistance and support. The chart showcases prior downtrend, recent recovery, and stalled momentum around the 50 level, making it a useful reference for market breadth and trend strength analysis for short-term trading strategies.
免责声明
这些信息和出版物并非旨在提供,也不构成TradingView提供或认可的任何形式的财务、投资、交易或其他类型的建议或推荐。请阅读使用条款了解更多信息。
免责声明
这些信息和出版物并非旨在提供,也不构成TradingView提供或认可的任何形式的财务、投资、交易或其他类型的建议或推荐。请阅读使用条款了解更多信息。