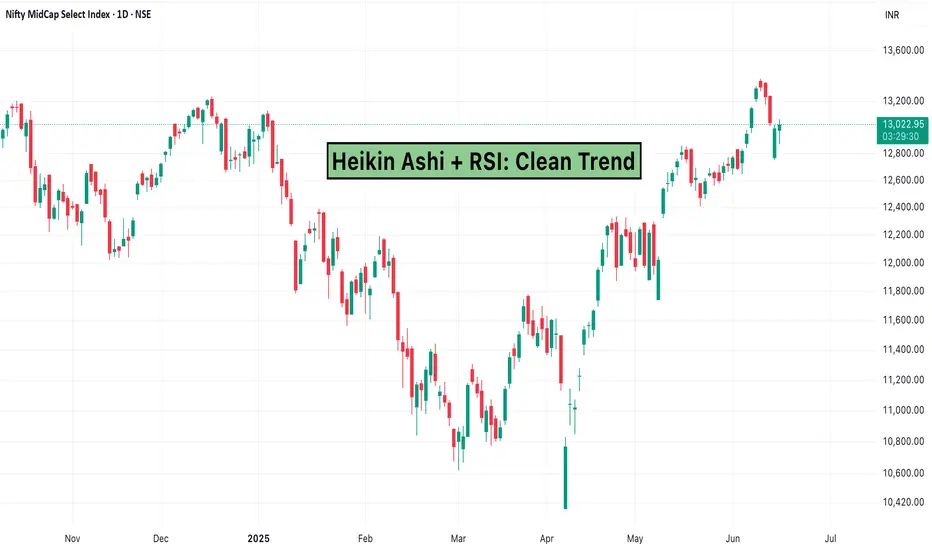
For traders who prefer clarity over noise, combining Heikin Ashi candles with the Relative Strength Index (RSI) can help reveal clean trend setups and momentum confirmations.
This duo is especially effective on TradingView for identifying smoother entries and exits.
What is Heikin Ashi?
Heikin Ashi is a chart type that modifies how candles are calculated:
What is RSI?
The Relative Strength Index (RSI) is a momentum oscillator ranging from 0 to 100:
Why Combine Them?
How to Trade It
Confirm with RSI:
Using on TradingView
Conclusion
This clean, visual strategy is perfect for traders who want to reduce whipsaws and act on strong signals. Whether you're swing trading or intraday trading, Heikin Ashi + RSI can bring clarity to your charts.
This duo is especially effective on TradingView for identifying smoother entries and exits.
What is Heikin Ashi?
Heikin Ashi is a chart type that modifies how candles are calculated:
- It averages price data to create smoother trends.
- Green candles indicate uptrends; red candles suggest downtrends.
- Wicks are often shorter, reducing market noise.
What is RSI?
The Relative Strength Index (RSI) is a momentum oscillator ranging from 0 to 100:
- Above 70: Overbought (potential pullback)
- Below 30: Oversold (potential bounce)
- RSI also helps confirm trend strength and entry points.
Why Combine Them?
- Heikin Ashi filters out noise, making trend direction easier to identify.
- RSI validates the trend with momentum strength.
- Together, they help you enter trades with higher conviction.
How to Trade It
- Identify trend direction with Heikin Ashi candles.
- Consecutive green candles = uptrend
- Consecutive red candles = downtrend
Confirm with RSI:
- RSI above 50 supports bullish trend
- RSI below 50 supports bearish trend
- Look for divergence or reversals using RSI near overbought/oversold levels.
Using on TradingView
- Select Heikin Ashi from chart type options.
- Add RSI from the Indicators tab.
- Use both together to align entries with the trend and strength.
Conclusion
This clean, visual strategy is perfect for traders who want to reduce whipsaws and act on strong signals. Whether you're swing trading or intraday trading, Heikin Ashi + RSI can bring clarity to your charts.
Elevate your Trading Experience 🚀
📱 Download Dhan App on iOS and Android and Start Trading.
📱 Download Dhan App on iOS and Android and Start Trading.
免责声明
这些信息和出版物并不意味着也不构成TradingView提供或认可的金融、投资、交易或其它类型的建议或背书。请在使用条款阅读更多信息。
免责声明
这些信息和出版物并不意味着也不构成TradingView提供或认可的金融、投资、交易或其它类型的建议或背书。请在使用条款阅读更多信息。