🔹 Intro / Overview
____________________________________________________________
📖 How to Identify
____________________________________________________________
📖 Key Points of Pattern
____________________________________________________________
🎯 Trading Plan (Educational Only)
____________________________________________________________
📊 Chart Explanation
____________________________________________________________
👀 Observations
____________________________________________________________
❗ Why It Matters
____________________________________________________________
🎯 Conclusion
____________________________________________________________
⚠️ Disclaimer
☕ The Cup and Handle is a 📈 bullish continuation pattern often studied in technical analysis.
⚔️ It forms when there is a fight between bulls 🐂 and bears 🐻 — the Cup develops as both remain strong.
📉 During the Handle, sellers 🛑 temporarily gain strength.
📈 But when price closes above the Validation Line, buyers regain control 💪 and bullish momentum dominates.
____________________________________________________________
📖 How to Identify
- ✅ Validation → The pattern is valid if price closes above the Validation Line.
- ❌ Devalidation → The pattern is invalid if price closes below the Devalidation Line(before Validation).
- 📉 Retracement Rule →The pattern is only confirmed if the price closes below the Retracement Line during the Handle formation.
- This ensures a proper pullback forms before breakout.
____________________________________________________________
📖 Key Points of Pattern
- ✅ A valid Cup requires the retracement condition — confirmation occurs only if price closes below the Retracement Line.
- ⚖️ Balanced Highs → Point A (left peak) and Point C (right peak) should be relatively close in price, ensuring a proper Cup shape 🍵.
- 🔒 The Handle must not break the structural integrity of the Cup.(No Close Below Devalidation Lines)
____________________________________________________________
🎯 Trading Plan (Educational Only)
- 📌 Entry → Considered only after confirmation when price closes above the Validation Line.
- 🛡️ Stop-Loss (SL) → After validation, the Devalidation Line may act as an SL.
- 🎯 Target (TP) →
- First Target → 1R (equal to the risk defined by Entry–SL distance).
- Remaining Lots → Trail using ATR, Fibonacci levels, Box Trailing, or structure-based stops.
____________________________________________________________
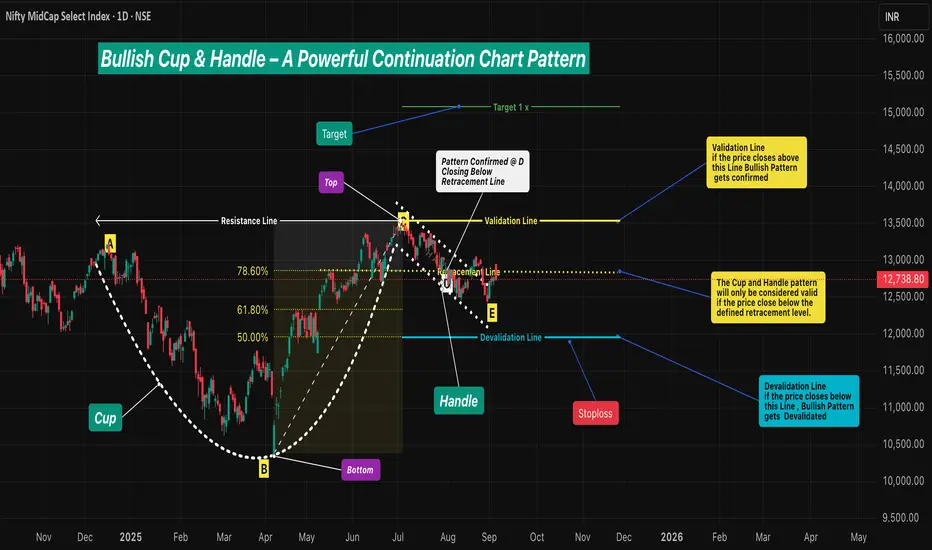
📊 Chart Explanation
- 🍵 The Cup forms with a rounded base Point B and two balanced tops: Point A (left peak) & Point C (right peak) - The marginal price difference should be small to ensure a reliable Cup.
- 📈 The Retracement Line (Point D) confirms the pattern only if price closes below the Fibonacci Level of 78.60% and above the 50.00% .
- 📉 The Handle develops as price pulls back, with Point E marking the Handle low. and Good Handle of Cup is Formed (this low should not go below 50.00% Level)
- 📏 The Fibonacci retracement levels are drawn from Point B (Cup base) to Point C (right peak). These levels provide a reference framework to observe Retracement (minimum 78.60%), Validation (100.00%), and Devalidation (50.00%) areas for educational study of the structure.
____________________________________________________________
👀 Observations
- ✨ Works best after a strong uptrend 🚀 or at major support–resistance zones 🧱.
- ⚖️ A balanced Cup (Top Right ≈ Top Left) improves reliability.
- 📏 Handle Formation
- The Handle should be shorter than the Cup depth — and should also be longer than the required minimum depth for proper structure.
- If the Handle is too deep, it weakens the setup — and also if it is too short, the formation loses reliability.
____________________________________________________________
❗ Why It Matters
- 🔍 Shows the market battle between buyers and sellers.
- 💪 Highlights how buyers regain dominance after retracement validation.
- ⚖️ Balanced structure + strict rules = better filtering of weak setups.
- 📝 Provides clarity on entry, SL, and TP with a structured framework.
____________________________________________________________
🎯 Conclusion
The Cup and Handle pattern, when validated through Fibonacci retracement rules 📉, balanced highs ⚖️, and proper Handle structure 🔒, offers a disciplined framework for studying bullish continuation setups.
🔥 Patterns don’t predict. Rules protect.
____________________________________________________________
⚠️ Disclaimer
📘 For educational purposes only.
🙅 Not SEBI registered.
❌ Not a buy/sell recommendation.
🧠 Purely a learning resource.
📊 Not Financial Advice.
免责声明
这些信息和出版物并非旨在提供,也不构成TradingView提供或认可的任何形式的财务、投资、交易或其他类型的建议或推荐。请阅读使用条款了解更多信息。
免责声明
这些信息和出版物并非旨在提供,也不构成TradingView提供或认可的任何形式的财务、投资、交易或其他类型的建议或推荐。请阅读使用条款了解更多信息。