搜索
产品
社区
市场
经纪商
更多
CN
开始
Nifty Oil & Gas Index
做多
10月5日
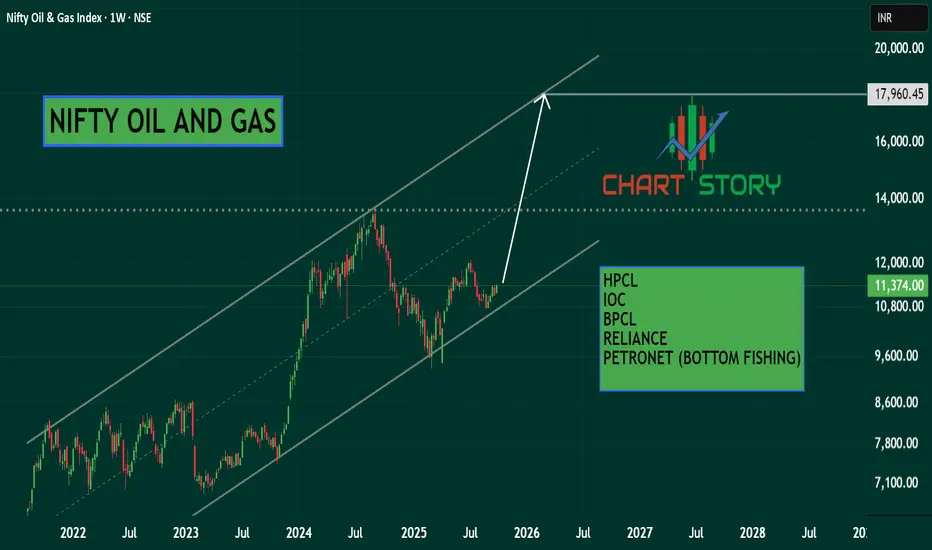
NIFTY OIL AND GAS INDEX - LONG
1
获取这个图表
获取这个图表
33
NIFTY_OIL_AND_GAS
Weekly index chart showing bottom it out with and its constituent chart also outperform the market like Hpcl, Bpcl, Ioc, Reliance on parabolic formation.
Chartstory_Jigar
关注
更多:
Chart Patterns
Technical Indicators
Trend Analysis
免责声明
这些信息和出版物并不意味着也不构成TradingView提供或认可的金融、投资、交易或其它类型的建议或背书。请在
使用条款
阅读更多信息。
Chart Patterns
Technical Indicators
Trend Analysis
Chartstory_Jigar
关注
更多:
免责声明
这些信息和出版物并不意味着也不构成TradingView提供或认可的金融、投资、交易或其它类型的建议或背书。请在
使用条款
阅读更多信息。