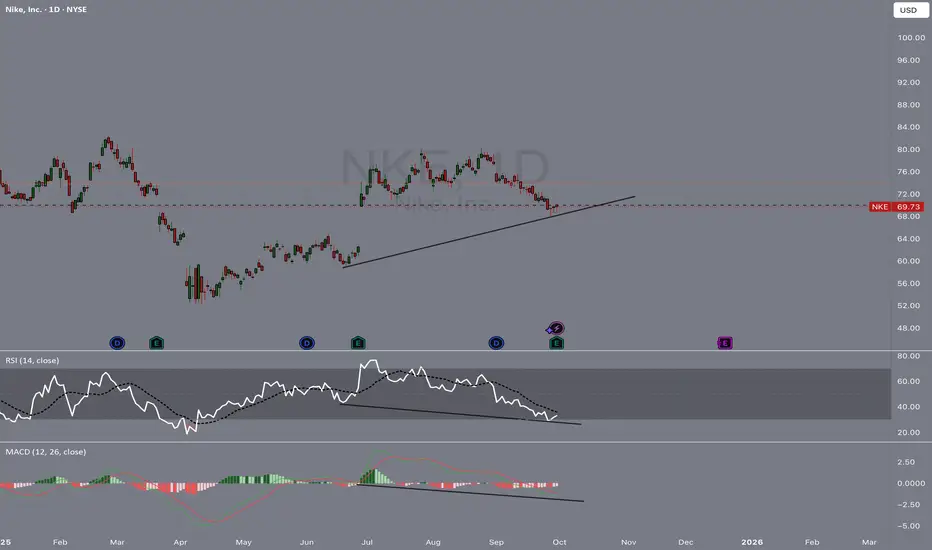
Price Action
- NKE has been in a downtrend, recently pulling back to trendline support around $69–$70.
- Price is testing this support zone, which aligns with prior structure.
Support & Resistance
- Key support: $69–$70 (trendline + horizontal level)
- Resistance: $73–$75 (recent breakdown zone)
RSI (Relative Strength Index)
- RSI (14) in a downtrend but showing bullish divergence (higher lows vs price making lower lows)
- Suggests potential bounce from oversold territory.
MACD (Moving Average Convergence Divergence)
- MACD is deeply negative but flattening.
- Potential for a momentum shift if buyers step in.
Overall Setup
- NKE is sitting on critical support with bullish divergence on RSI!
- Bounce toward $73–$75 possible if support holds!
- Breakdown below $69 could open downside toward $65!
免责声明
这些信息和出版物并不意味着也不构成TradingView提供或认可的金融、投资、交易或其它类型的建议或背书。请在使用条款阅读更多信息。
免责声明
这些信息和出版物并不意味着也不构成TradingView提供或认可的金融、投资、交易或其它类型的建议或背书。请在使用条款阅读更多信息。