Key Levels to Watch
Support Levels
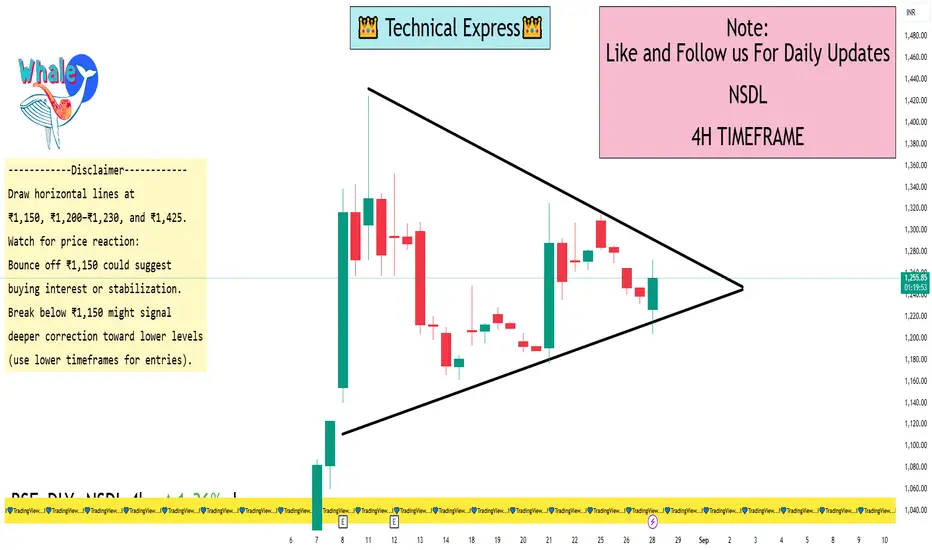
₹1,150 — Analysts highlight this as a critical support. Post-Q1, NSDL dropped nearly 9% in two sessions, and ₹1,150 is seen as a potential line of defense. A break below may lead to sharper losses.
₹1,200–₹1,230 — Near the stock's current region (around ₹1,237), which can act as a short-term base due to recent consolidation and VWAP alignment.
Resistance Levels
₹1,425 — The recent all-time high reached after a strong post-IPO rally. Forms a clear resistance zone.
Technical Context & Market Sentiment
Recent Rally: NSDL surged ~78% from its ₹800 IPO price and ~62% from its ₹880 listing price, peaking near ₹1,425.
Profit Booking: The sharp decline post-Q1 earnings reflects investor caution and stretched valuations, reinforcing the significance of the ₹1,150 level.
How to Use These Levels on Your 4-Hour Chart
Draw horizontal lines at ₹1,150, ₹1,200–₹1,230, and ₹1,425.
Watch for price reaction:
Bounce off ₹1,150 could suggest buying interest or stabilization.
Break below ₹1,150 might signal deeper correction toward lower levels (use lower timeframes for entries).
Advances toward ₹1,425 could reignite bullish momentum if volume supports the move.
Combine with indicators:
Moving Averages (e.g., 20/50 EMA) — can offer dynamic support/resistance.
RSI/MACD — monitor for divergence or overbought/oversold conditions to time entries or exits.
Confirm before acting:
Look for candlestick signals (pin bars, engulfing patterns) around these zones.
Volume spikes on breakouts or bounces add conviction.
Support Levels
₹1,150 — Analysts highlight this as a critical support. Post-Q1, NSDL dropped nearly 9% in two sessions, and ₹1,150 is seen as a potential line of defense. A break below may lead to sharper losses.
₹1,200–₹1,230 — Near the stock's current region (around ₹1,237), which can act as a short-term base due to recent consolidation and VWAP alignment.
Resistance Levels
₹1,425 — The recent all-time high reached after a strong post-IPO rally. Forms a clear resistance zone.
Technical Context & Market Sentiment
Recent Rally: NSDL surged ~78% from its ₹800 IPO price and ~62% from its ₹880 listing price, peaking near ₹1,425.
Profit Booking: The sharp decline post-Q1 earnings reflects investor caution and stretched valuations, reinforcing the significance of the ₹1,150 level.
How to Use These Levels on Your 4-Hour Chart
Draw horizontal lines at ₹1,150, ₹1,200–₹1,230, and ₹1,425.
Watch for price reaction:
Bounce off ₹1,150 could suggest buying interest or stabilization.
Break below ₹1,150 might signal deeper correction toward lower levels (use lower timeframes for entries).
Advances toward ₹1,425 could reignite bullish momentum if volume supports the move.
Combine with indicators:
Moving Averages (e.g., 20/50 EMA) — can offer dynamic support/resistance.
RSI/MACD — monitor for divergence or overbought/oversold conditions to time entries or exits.
Confirm before acting:
Look for candlestick signals (pin bars, engulfing patterns) around these zones.
Volume spikes on breakouts or bounces add conviction.
I built a Buy & Sell Signal Indicator with 85% accuracy.
📈 Get access via DM or
WhatsApp: wa.link/d997q0
Contact - +91 76782 40962
| Email: techncialexpress@gmail.com
| Script Coder | Trader | Investor | From India
📈 Get access via DM or
WhatsApp: wa.link/d997q0
Contact - +91 76782 40962
| Email: techncialexpress@gmail.com
| Script Coder | Trader | Investor | From India
相关出版物
免责声明
这些信息和出版物并非旨在提供,也不构成TradingView提供或认可的任何形式的财务、投资、交易或其他类型的建议或推荐。请阅读使用条款了解更多信息。