Is $5T reasonable for NVDA?
• Mechanically, yes: The market only needs ~10% near-term appreciation from today’s levels to print $5T. That’s within one strong quarter or a guidance beat.
• Fundamentally, the math works if (a) FY26–27 revenue tracks the guide/Street trajectory (TTM already $165B with Q3 guide $54B), (b) non-GAAP GMs hover low-to-mid-70s, and (c) opex discipline holds. Under those, forward EPS path supports ~35× at $5T, a premium but not outlandish for a category-defining compute platform.
• Free-cash optionality: With ~$48B net cash and massive FCF, NVDA can keep funding buybacks (already $60B fresh authorization) and capacity, smoothing cycles.
________________________________________
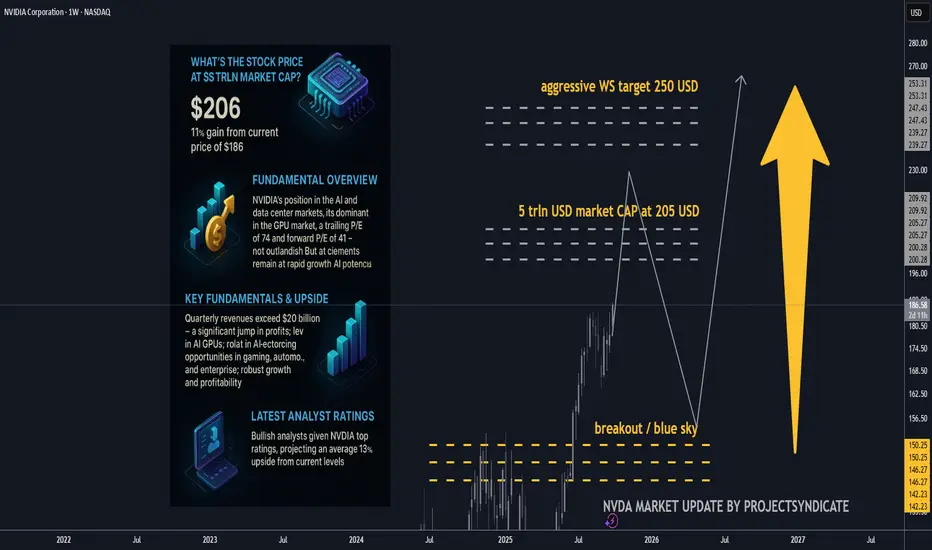
• Stock price at $5T market cap: ≈ $205.8 per share (on ~24.3B shares).
• Gain needed from $186.6: +$19.2 (~+10.3%).
The quick math (market cap ⇒ price)
• Shares outstanding (basic): ~24.3 B (as of Aug 22, 2025, per 10-Q).
• Stock @ $5T market cap: $5,000,000,000,000 ÷ 24.3B ≈ $205.8/share.
• From today’s price $186.6: needs +$19.2 or ~+10.3%.
That also implies P/E (TTM) at $5T of roughly ~56× (using TTM EPS ~3.68). Today’s trailing P/E is ~50–53× depending on feed.
________________________________________
Core fundamentals snapshot 🧩
Latest quarter (Q2 FY26, reported Aug 27, 2025)
• Revenue: $46.7B (+56% y/y; +6% q/q).
• Data Center revenue: $41.1B (+56% y/y).
• GAAP gross margin: 72.4%; non-GAAP 72.7%; Q3 guide ~73.3–73.5%.
• GAAP EPS: $1.08 (non-GAAP: $1.05; excl. $180M inventory release: $1.04).
TTM scale & profitability
• Revenue (TTM): ~$165.2B.
• Net income (TTM): ~$86.6B.
• Diluted EPS (TTM): ~$3.5–3.7.
• Cash & marketable securities: $56.8B; debt: ~$8.5–10.6B ⇒ net cash ≈ $48B.
Capital returns
• $24.3B returned in 1H FY26; new $60B buyback authorization (no expiration). Remaining buyback capacity ~$71B as of Aug 26.
________________________________________
Valuation read (today vs. $5T)
Using widely watched metrics:
• P/E (TTM): ~50–53× today; at $5T it rises to ~56× (assuming flat TTM EPS).
• Forward P/E: Street FY27 EPS ≈ $5.91 → ~31–33× today; ~35× at $5T — still below many AI hyper-growth narratives that trade at 40–50× forward when growth visibility is high.
• EV/EBITDA (TTM): EV ≈ market cap – net cash. Today EV ~$4.45T; EBITDA TTM ≈ $98–103B ⇒ EV/EBITDA ~43–45×; at $5T EV/EBITDA drifts to ~48–50×.
• P/S (TTM): ~27× today (at $4.5T) and ~30× at $5T on $165.2B TTM revenue.
• FCF yield: TTM FCF range $60.9–72.0B ⇒ ~1.35–1.60% today; ~1.22–1.44% at $5T.
Takeaway: $5T doesn’t require a heroic repricing — it’s ~10% above spot and implies ~35× forward earnings if consensus holds. That’s rich vs. the S&P (~22.5× forward) but arguably reasonable given NVDA’s growth, margins, and quasi-platform status in AI compute.
________________________________________
What must be true to justify $5T (and beyond) ✅
1. AI capex “supercycle” persists/expands. Citi now models $490B hyperscaler AI capex in 2026 (up from $420B) and trillions through 2029–30. A sustained 40–50% NVDA wallet share across compute+networking underwrites revenue momentum and margin sustainment.
2. Annual product cadence holds. Blackwell today → Rubin in 2026 with higher power & bandwidth, widening the perf gap vs. AMD MI450 — supports pricing power and mix.
3. Margins stay “mid-70s” non-GAAP. Company guides ~73.3–73.5% near term; sustaining 70%+ through transitions offsets any unit price compression.
4. Networking, software & systems scale. NVLink/Spectrum, NVL systems and CUDA/Enterprise subscriptions deepen the moat and smooth cyclicality; attach expands TAM (improves EV/EBITDA vs. pure-GPU lens).
5. China/export workarounds do not derail mix. Q2 had no H20 China sales; guidance and commentary frame this as manageable with non-China demand and limited H20 redirection.
________________________________________
A contrarian check (where the model could break) 🧨
• Power & grid bottlenecks. Even bulls (Citi) note AI buildouts imply tens of GW of incremental power; slippage in datacenter electrification can defer GPU racks, elongating deployments (and revenue recognition).
• Debt-funded AI spend. Rising share of AI DC capex is being levered (Oracle’s $18B bonds; neoclouds borrowing against NVDA GPUs). If credit windows tighten, orders could wobble.
• Customer consolidation & vertical ASICs. Hyperscalers iterating custom silicon could cap NVDA’s mix/price in some workloads; edge inference may fragment.
• China policy volatility. Export rules already forced product pivots; rebounds are uncertain and not fully in NVDA’s control.
• Multiple risk. At ~50× TTM and >40× EV/EBITDA, any growth decel (unit or pricing) can de-rate the multiple faster than earnings make up the gap.
Bottom line of the bear case: If AI capex normalizes faster (say +10–15% CAGR instead of +25–35%), forward EPS still grows, but the stock would likely need multiple compression (toward ~25–30× forward), making $5T less sticky near-term.
________________________________________
Street positioning (latest bullish calls) 📣
• KeyBanc: $250 (Overweight) — Rubin cycle deepens moat → ~+34% implied upside.
• Barclays: $240 (Overweight) — AI infra wave; higher multiple to 35×. ~+29% upside.
• Bank of America: $235 (Buy). ~+26% upside.
• Bernstein: $225 (Outperform). ~+21% upside.
• Citi: $210 (Buy) — reiterates annual cadence & rising AI capex.
• Morgan Stanley: $206–210 (Overweight). ~+11–13% upside; 33× CY25 EPS framework.
• Consensus: Avg 12-mo PT ~$211, ~+13% from here.
________________________________________
________________________________________
Extra color you can trade on 🎯
• Where bulls may be too conservative:
o Networking/NVLink attach could outgrow GPUs as Blackwell/Rubin systems standardize on NVIDIA fabric, defending blended margins longer.
o Software monetization (CUDA ecosystem, NIMs, enterprise inference toolchains) is still under-modeled in many sell-side DCFs.
• Where bulls may be too aggressive:
o China rebound timing & magnitude.
o Power/real-estate constraints delaying deployments into 2026.
o Credit-driven AI capex — watch for any signs of tightening in private credit / neocloud financing that uses GPUs as collateral.
________________________________________
________________________________________
Sources: NVIDIA IR & 10-Q; Yahoo Finance stats; StockAnalysis (TTM financials); company Q2 FY26 press release and CFO commentary; recent analyst notes from KeyBanc, Citi, Barclays, BofA, Morgan Stanley; financial media coverage (WSJ/FT).
• Mechanically, yes: The market only needs ~10% near-term appreciation from today’s levels to print $5T. That’s within one strong quarter or a guidance beat.
• Fundamentally, the math works if (a) FY26–27 revenue tracks the guide/Street trajectory (TTM already $165B with Q3 guide $54B), (b) non-GAAP GMs hover low-to-mid-70s, and (c) opex discipline holds. Under those, forward EPS path supports ~35× at $5T, a premium but not outlandish for a category-defining compute platform.
• Free-cash optionality: With ~$48B net cash and massive FCF, NVDA can keep funding buybacks (already $60B fresh authorization) and capacity, smoothing cycles.
________________________________________
• Stock price at $5T market cap: ≈ $205.8 per share (on ~24.3B shares).
• Gain needed from $186.6: +$19.2 (~+10.3%).
The quick math (market cap ⇒ price)
• Shares outstanding (basic): ~24.3 B (as of Aug 22, 2025, per 10-Q).
• Stock @ $5T market cap: $5,000,000,000,000 ÷ 24.3B ≈ $205.8/share.
• From today’s price $186.6: needs +$19.2 or ~+10.3%.
That also implies P/E (TTM) at $5T of roughly ~56× (using TTM EPS ~3.68). Today’s trailing P/E is ~50–53× depending on feed.
________________________________________
Core fundamentals snapshot 🧩
Latest quarter (Q2 FY26, reported Aug 27, 2025)
• Revenue: $46.7B (+56% y/y; +6% q/q).
• Data Center revenue: $41.1B (+56% y/y).
• GAAP gross margin: 72.4%; non-GAAP 72.7%; Q3 guide ~73.3–73.5%.
• GAAP EPS: $1.08 (non-GAAP: $1.05; excl. $180M inventory release: $1.04).
TTM scale & profitability
• Revenue (TTM): ~$165.2B.
• Net income (TTM): ~$86.6B.
• Diluted EPS (TTM): ~$3.5–3.7.
• Cash & marketable securities: $56.8B; debt: ~$8.5–10.6B ⇒ net cash ≈ $48B.
Capital returns
• $24.3B returned in 1H FY26; new $60B buyback authorization (no expiration). Remaining buyback capacity ~$71B as of Aug 26.
________________________________________
Valuation read (today vs. $5T)
Using widely watched metrics:
• P/E (TTM): ~50–53× today; at $5T it rises to ~56× (assuming flat TTM EPS).
• Forward P/E: Street FY27 EPS ≈ $5.91 → ~31–33× today; ~35× at $5T — still below many AI hyper-growth narratives that trade at 40–50× forward when growth visibility is high.
• EV/EBITDA (TTM): EV ≈ market cap – net cash. Today EV ~$4.45T; EBITDA TTM ≈ $98–103B ⇒ EV/EBITDA ~43–45×; at $5T EV/EBITDA drifts to ~48–50×.
• P/S (TTM): ~27× today (at $4.5T) and ~30× at $5T on $165.2B TTM revenue.
• FCF yield: TTM FCF range $60.9–72.0B ⇒ ~1.35–1.60% today; ~1.22–1.44% at $5T.
Takeaway: $5T doesn’t require a heroic repricing — it’s ~10% above spot and implies ~35× forward earnings if consensus holds. That’s rich vs. the S&P (~22.5× forward) but arguably reasonable given NVDA’s growth, margins, and quasi-platform status in AI compute.
________________________________________
What must be true to justify $5T (and beyond) ✅
1. AI capex “supercycle” persists/expands. Citi now models $490B hyperscaler AI capex in 2026 (up from $420B) and trillions through 2029–30. A sustained 40–50% NVDA wallet share across compute+networking underwrites revenue momentum and margin sustainment.
2. Annual product cadence holds. Blackwell today → Rubin in 2026 with higher power & bandwidth, widening the perf gap vs. AMD MI450 — supports pricing power and mix.
3. Margins stay “mid-70s” non-GAAP. Company guides ~73.3–73.5% near term; sustaining 70%+ through transitions offsets any unit price compression.
4. Networking, software & systems scale. NVLink/Spectrum, NVL systems and CUDA/Enterprise subscriptions deepen the moat and smooth cyclicality; attach expands TAM (improves EV/EBITDA vs. pure-GPU lens).
5. China/export workarounds do not derail mix. Q2 had no H20 China sales; guidance and commentary frame this as manageable with non-China demand and limited H20 redirection.
________________________________________
A contrarian check (where the model could break) 🧨
• Power & grid bottlenecks. Even bulls (Citi) note AI buildouts imply tens of GW of incremental power; slippage in datacenter electrification can defer GPU racks, elongating deployments (and revenue recognition).
• Debt-funded AI spend. Rising share of AI DC capex is being levered (Oracle’s $18B bonds; neoclouds borrowing against NVDA GPUs). If credit windows tighten, orders could wobble.
• Customer consolidation & vertical ASICs. Hyperscalers iterating custom silicon could cap NVDA’s mix/price in some workloads; edge inference may fragment.
• China policy volatility. Export rules already forced product pivots; rebounds are uncertain and not fully in NVDA’s control.
• Multiple risk. At ~50× TTM and >40× EV/EBITDA, any growth decel (unit or pricing) can de-rate the multiple faster than earnings make up the gap.
Bottom line of the bear case: If AI capex normalizes faster (say +10–15% CAGR instead of +25–35%), forward EPS still grows, but the stock would likely need multiple compression (toward ~25–30× forward), making $5T less sticky near-term.
________________________________________
Street positioning (latest bullish calls) 📣
• KeyBanc: $250 (Overweight) — Rubin cycle deepens moat → ~+34% implied upside.
• Barclays: $240 (Overweight) — AI infra wave; higher multiple to 35×. ~+29% upside.
• Bank of America: $235 (Buy). ~+26% upside.
• Bernstein: $225 (Outperform). ~+21% upside.
• Citi: $210 (Buy) — reiterates annual cadence & rising AI capex.
• Morgan Stanley: $206–210 (Overweight). ~+11–13% upside; 33× CY25 EPS framework.
• Consensus: Avg 12-mo PT ~$211, ~+13% from here.
________________________________________
________________________________________
Extra color you can trade on 🎯
• Where bulls may be too conservative:
o Networking/NVLink attach could outgrow GPUs as Blackwell/Rubin systems standardize on NVIDIA fabric, defending blended margins longer.
o Software monetization (CUDA ecosystem, NIMs, enterprise inference toolchains) is still under-modeled in many sell-side DCFs.
• Where bulls may be too aggressive:
o China rebound timing & magnitude.
o Power/real-estate constraints delaying deployments into 2026.
o Credit-driven AI capex — watch for any signs of tightening in private credit / neocloud financing that uses GPUs as collateral.
________________________________________
________________________________________
Sources: NVIDIA IR & 10-Q; Yahoo Finance stats; StockAnalysis (TTM financials); company Q2 FY26 press release and CFO commentary; recent analyst notes from KeyBanc, Citi, Barclays, BofA, Morgan Stanley; financial media coverage (WSJ/FT).
注释
🎁Please hit the like button and🎁Leave a comment to support our team!
注释
short summary of the detailed overview:🚀 NVDA Stock: Path to $5 Trillion Market Cap
🖥️ 1. Current Market Cap: $4.5T — trading at ~$186/share.
📈 2. $5T Target Price: ~$206/share → needs ~+10% gain.
💰 3. Earnings Power: TTM EPS ~$3.7; Forward EPS FY27 ~$5.9.
🔢 4. Valuation Check: P/E (TTM) ~50× today → ~56× at $5T; Forward P/E ~31–33× today → ~35× at $5T.
💹 5. Revenue Momentum: TTM revenue ~$165B; Q2 FY26 revenue $46.7B (+56% y/y).
💎 6. Profitability: Non-GAAP gross margins ~73%; net income TTM ~$86B.
💵 7. Capital Returns: $24B returned in 1H FY26; $60B fresh buyback authorized, ~$71B capacity left.
⚡ 8. Growth Drivers: AI data center capex supercycle, Rubin (2026) GPU launch, NVLink/Spectrum networking, CUDA ecosystem.
🛑 9. Risks: Power/grid bottlenecks, debt-funded AI spend, custom silicon by hyperscalers, export restrictions.
📊 10. Analyst Consensus: Avg PT ~$211 (+13% upside). KeyBanc tops at $250 (+34% upside).
交易开始
taplink.cc/black001
🔱Syndicate Black MT4/MT5
⚡️Gold/FX Auto-Trading bot
🔱100%/week max DD <10%
📕verified 500%+ gains
🏧GOLD EA target 100%+ gains/week
🚀supercharge your trading
💎75% win rate gold signals
t.me/syndicategold001
🔱Syndicate Black MT4/MT5
⚡️Gold/FX Auto-Trading bot
🔱100%/week max DD <10%
📕verified 500%+ gains
🏧GOLD EA target 100%+ gains/week
🚀supercharge your trading
💎75% win rate gold signals
t.me/syndicategold001
相关出版物
免责声明
这些信息和出版物并不意味着也不构成TradingView提供或认可的金融、投资、交易或其它类型的建议或背书。请在使用条款阅读更多信息。